Process Monitoring in N|Solid [2/10] The best APM for Node, layer by layer.

When we are executing an application with a significant number of processes, we cannot afford to stop the operation to review what is happening outside of production, for this reason, a tool that allows us to have greater observability and a level of detail is key in the management of our project.
With N|Solid our purpose is to track in production what is happening with your application by monitoring and analyzing the information in real-time, generating reports, and thus giving you the tools to take actions to mitigate risks, reduce downtime, or invest more development time.
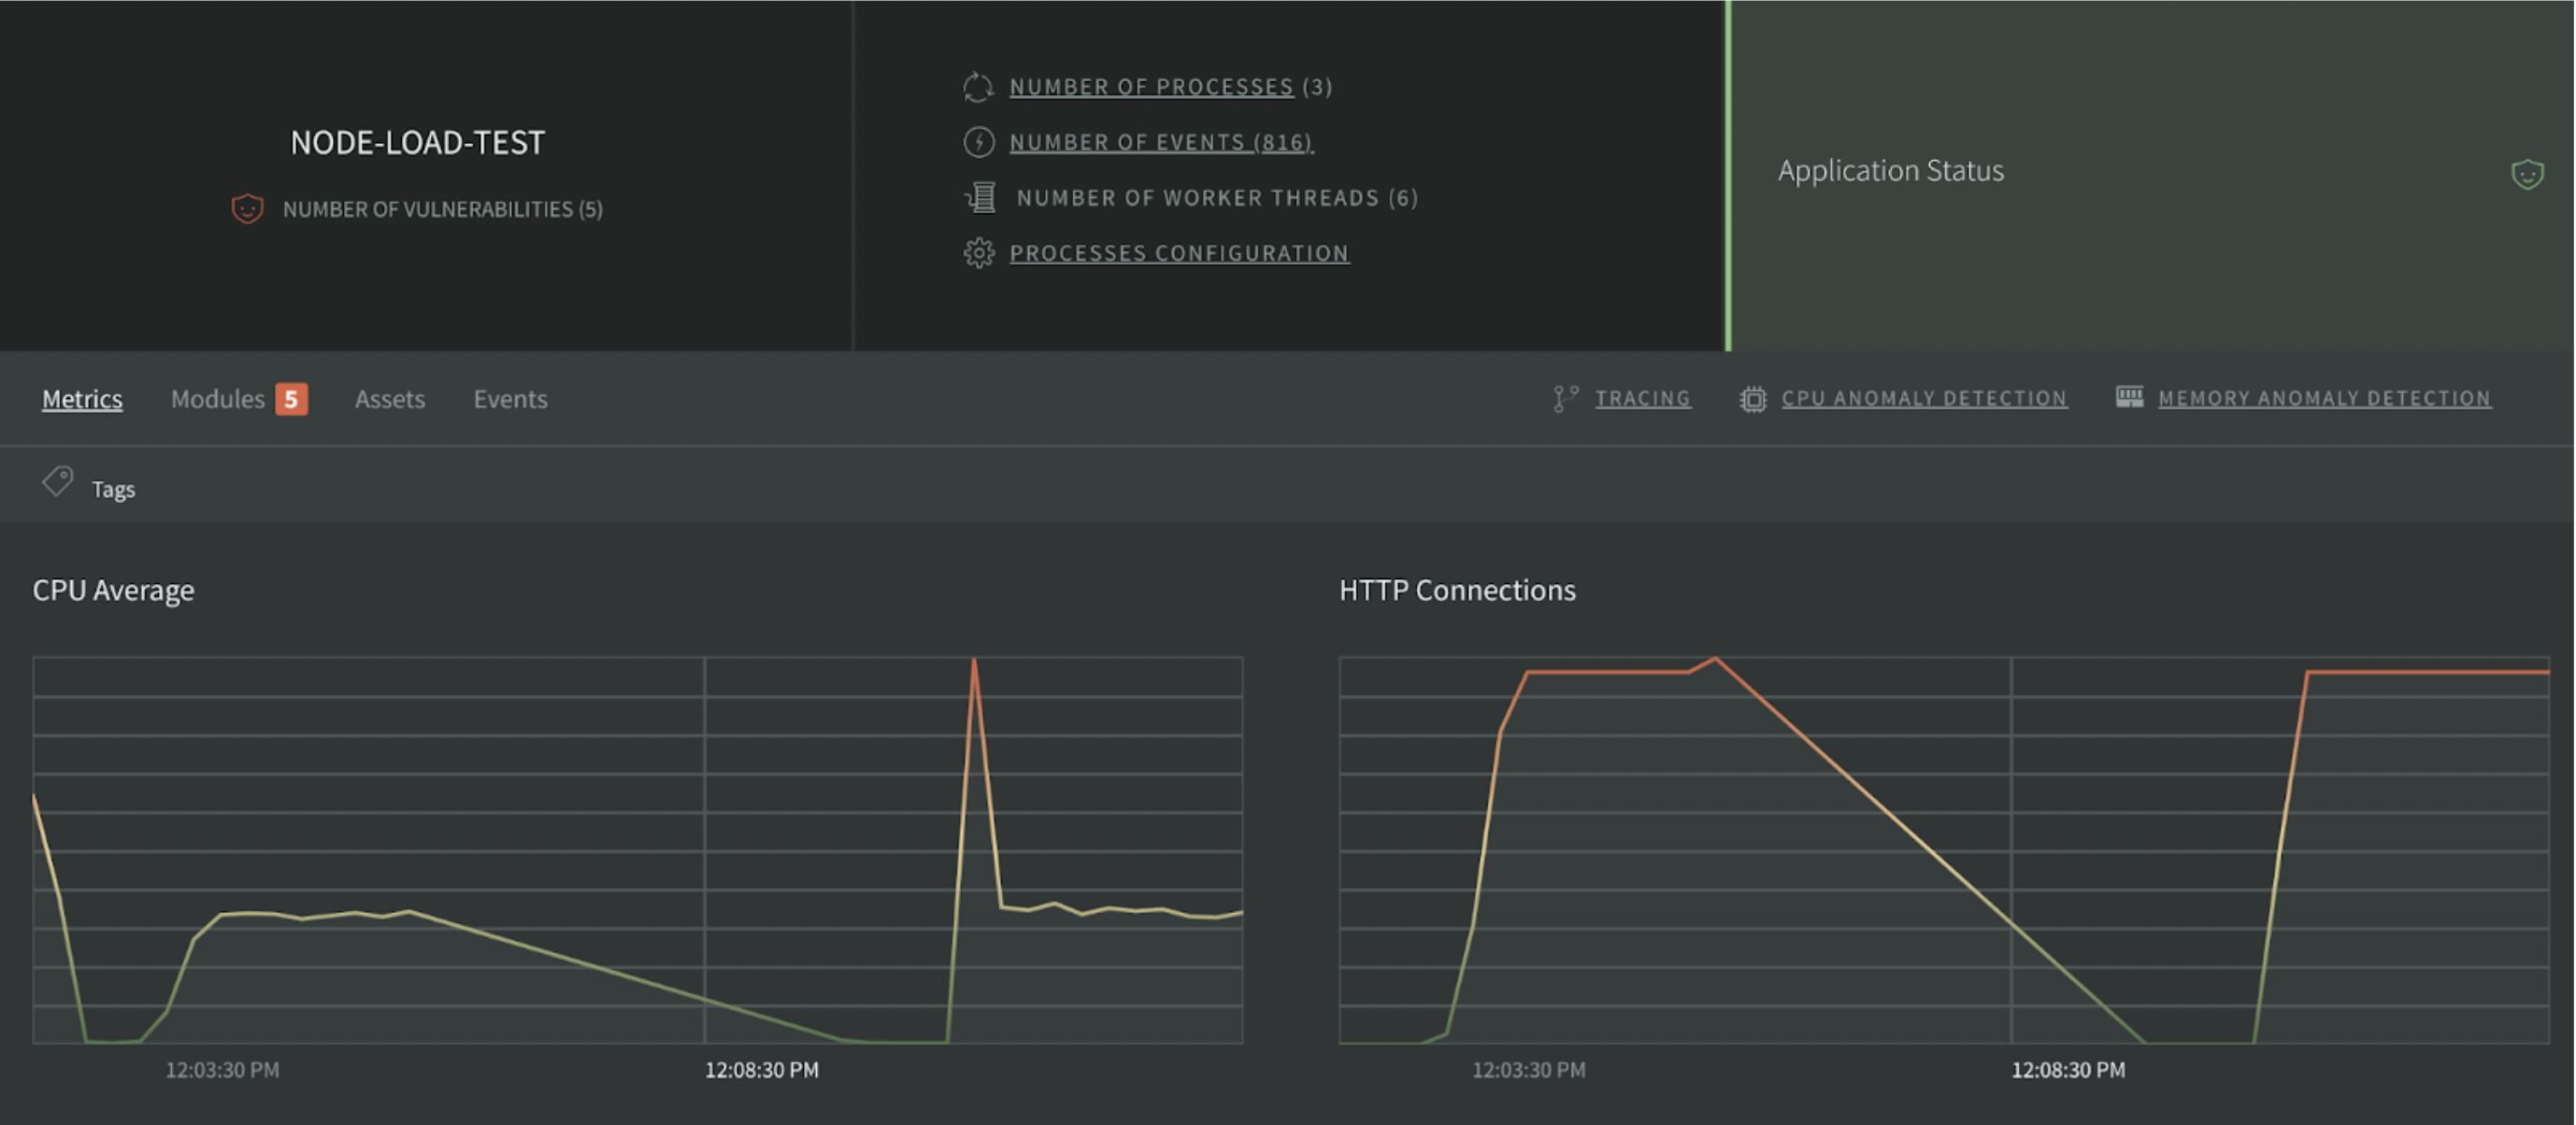 Img1 - Application Summary - N|Solid
As a developer, If you detect an issue in your application, without a doubt the first approach will be to understand what is happening, this means taking a closer look at the Processes. In N|Solid, through the Scatter Plot (Each process is represented by different colored points on a scatter plot) of the application, you can review the Heap Used, and CPU Average.
![]()
Img2 - Scatterplot Tracking- N|Solid
- Custom View Selector
- Filter Selector
- Tracked Process Data
- Process List
- Process Tracking Toggle
- Metrics Selector
Depending on the type of application you probably want to explore other metrics; For example, if your application is a REST API it will receive a lot of requests, you would switch your views to HTTP Request & Client request count. This gives you good insights into the behavior of your application.
You can also change the view to understand many other aspects of the application including; the 5-minute Load Average, Active Handles, CPU Used (%), and more. Further, you can see a detail of how the process is behaving over a period of time and use different graphs to showcase behavior.
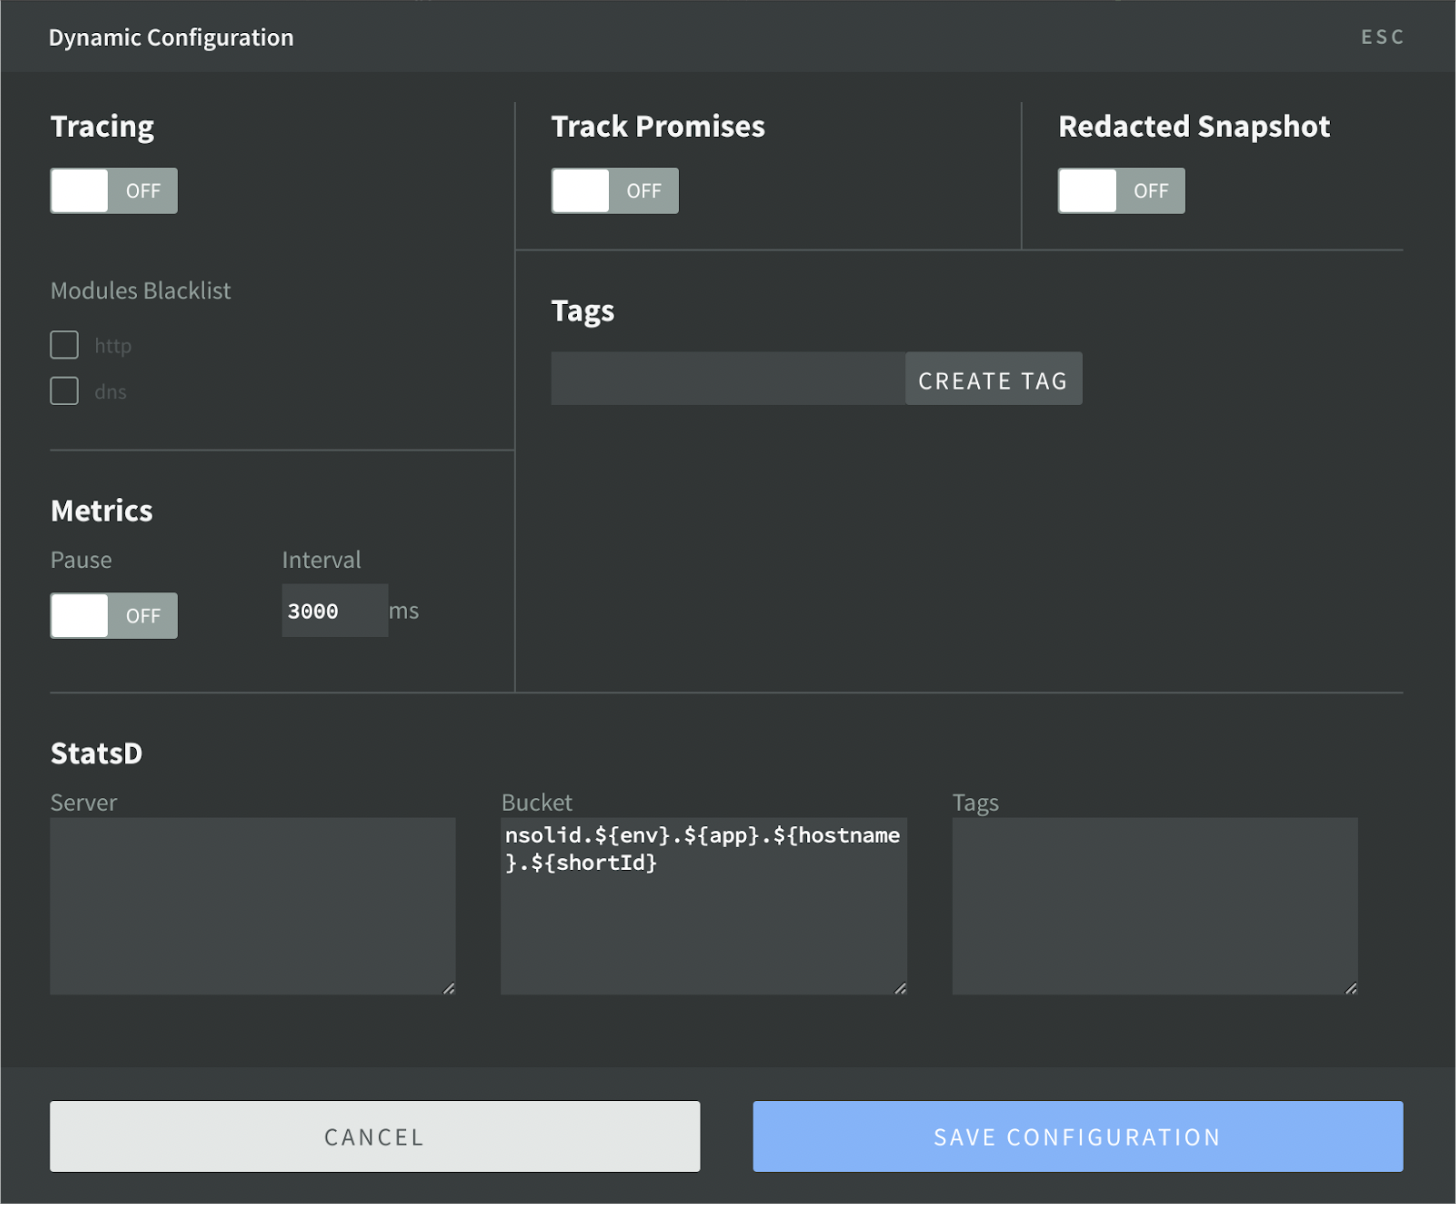 Img3 - Application Configuration - N|Solid
Process Monitoring —Zoom in—
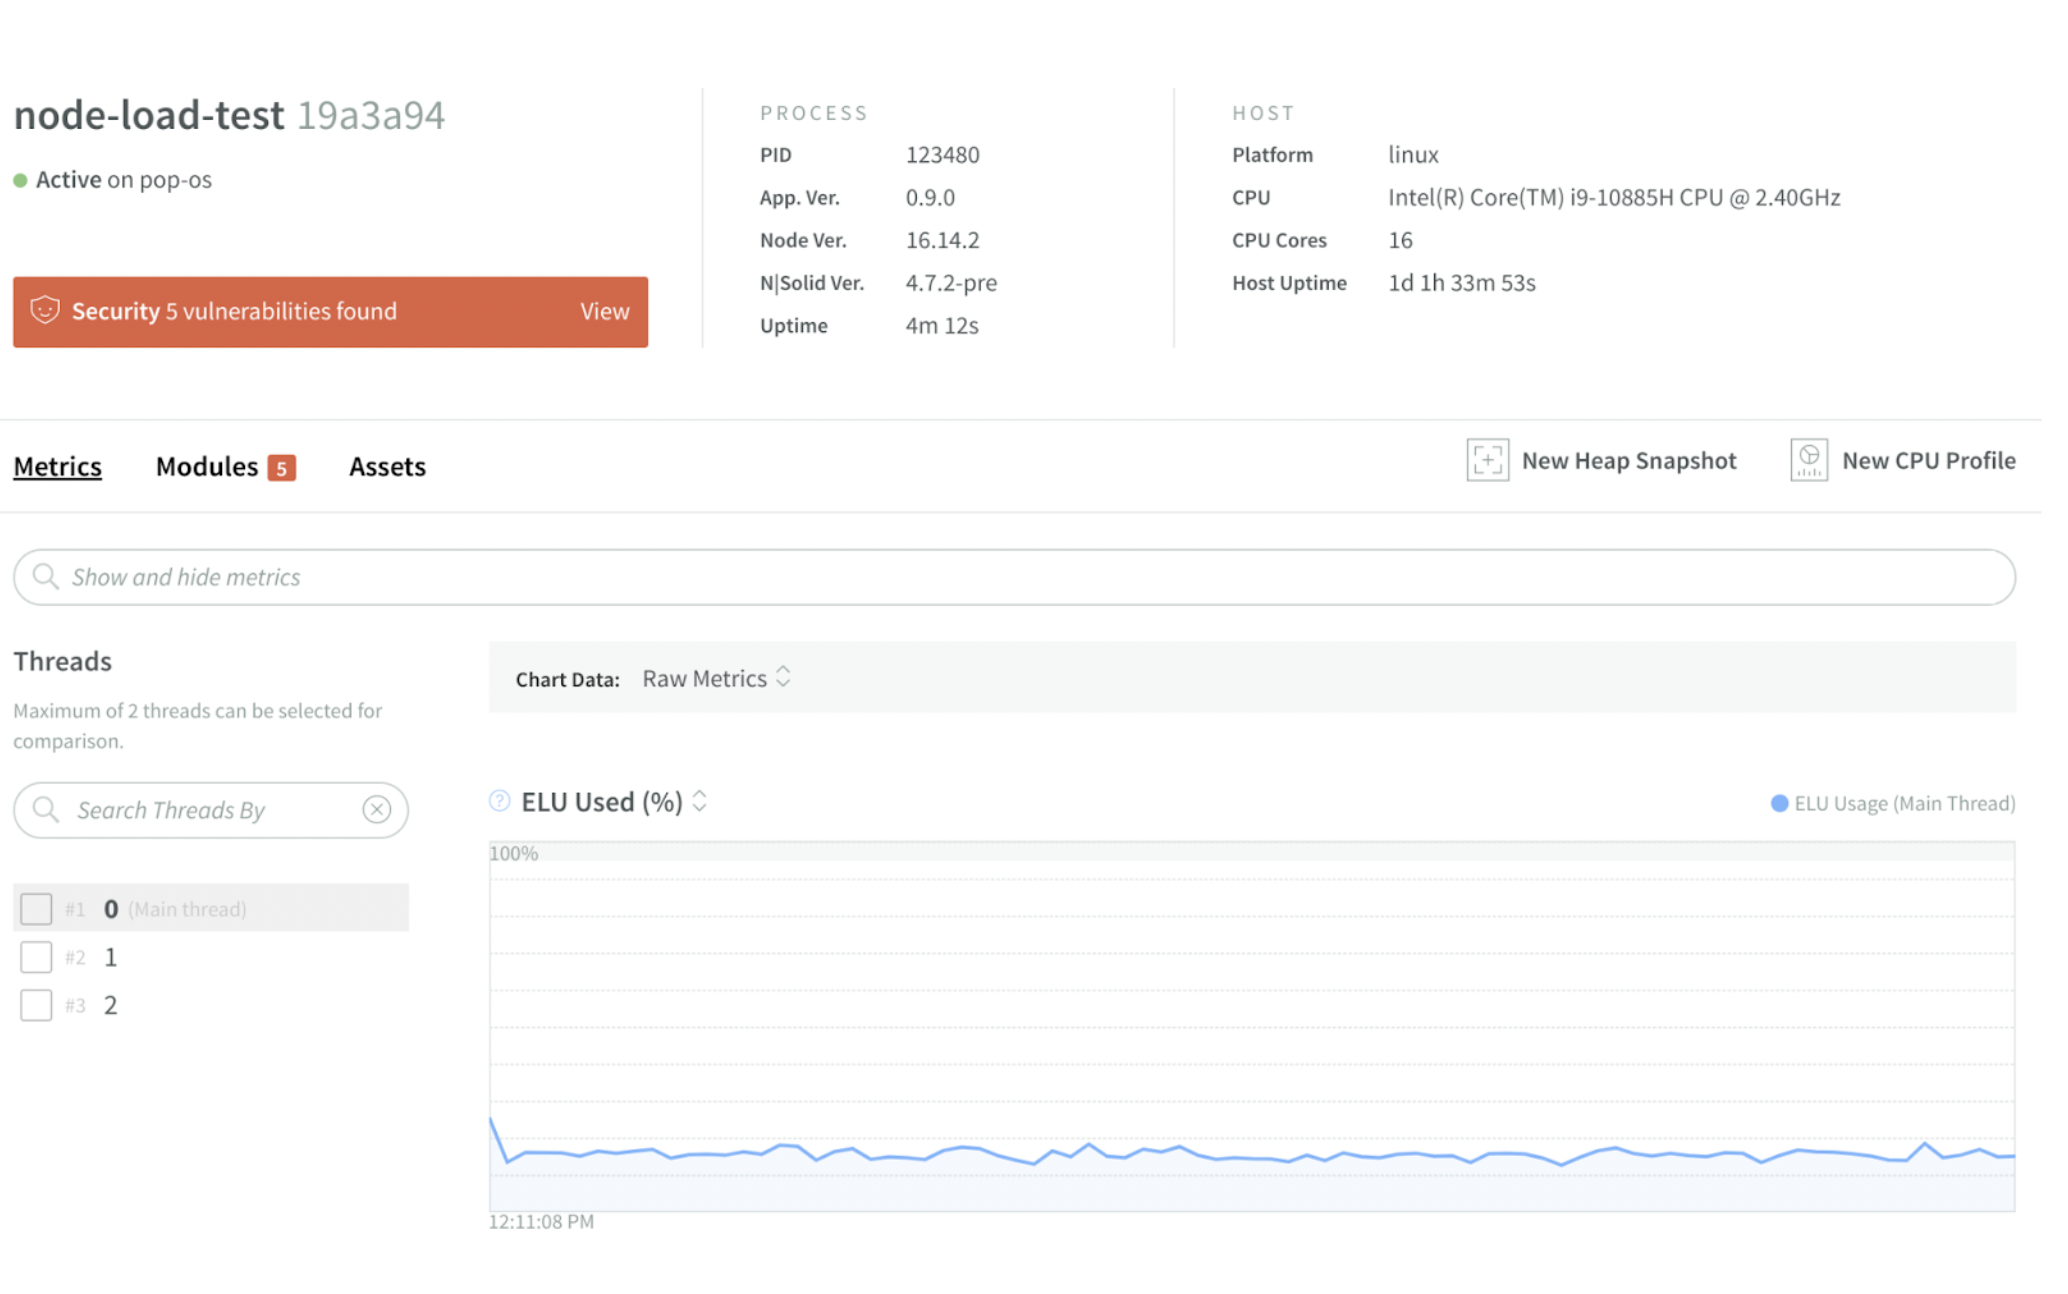 Img4 - Process Details - N|Solid
- Advantage: Access deep performance insights.
- Benefit: Build more reliable, secure, and performant applications.
Monitor your Node.js processes with low-impact performance insights and greater security.
- The most advanced Node.js monitoring and diagnostic tools to help identify and tackle tricky issues.
- Deep performance insights to build highly reliable applications minimizing infrastructure costs.
- Mitigate unseen security risks with custom security policies and real-time vulnerability scanning.
Demo Video — Process Monitoring in N|Solid
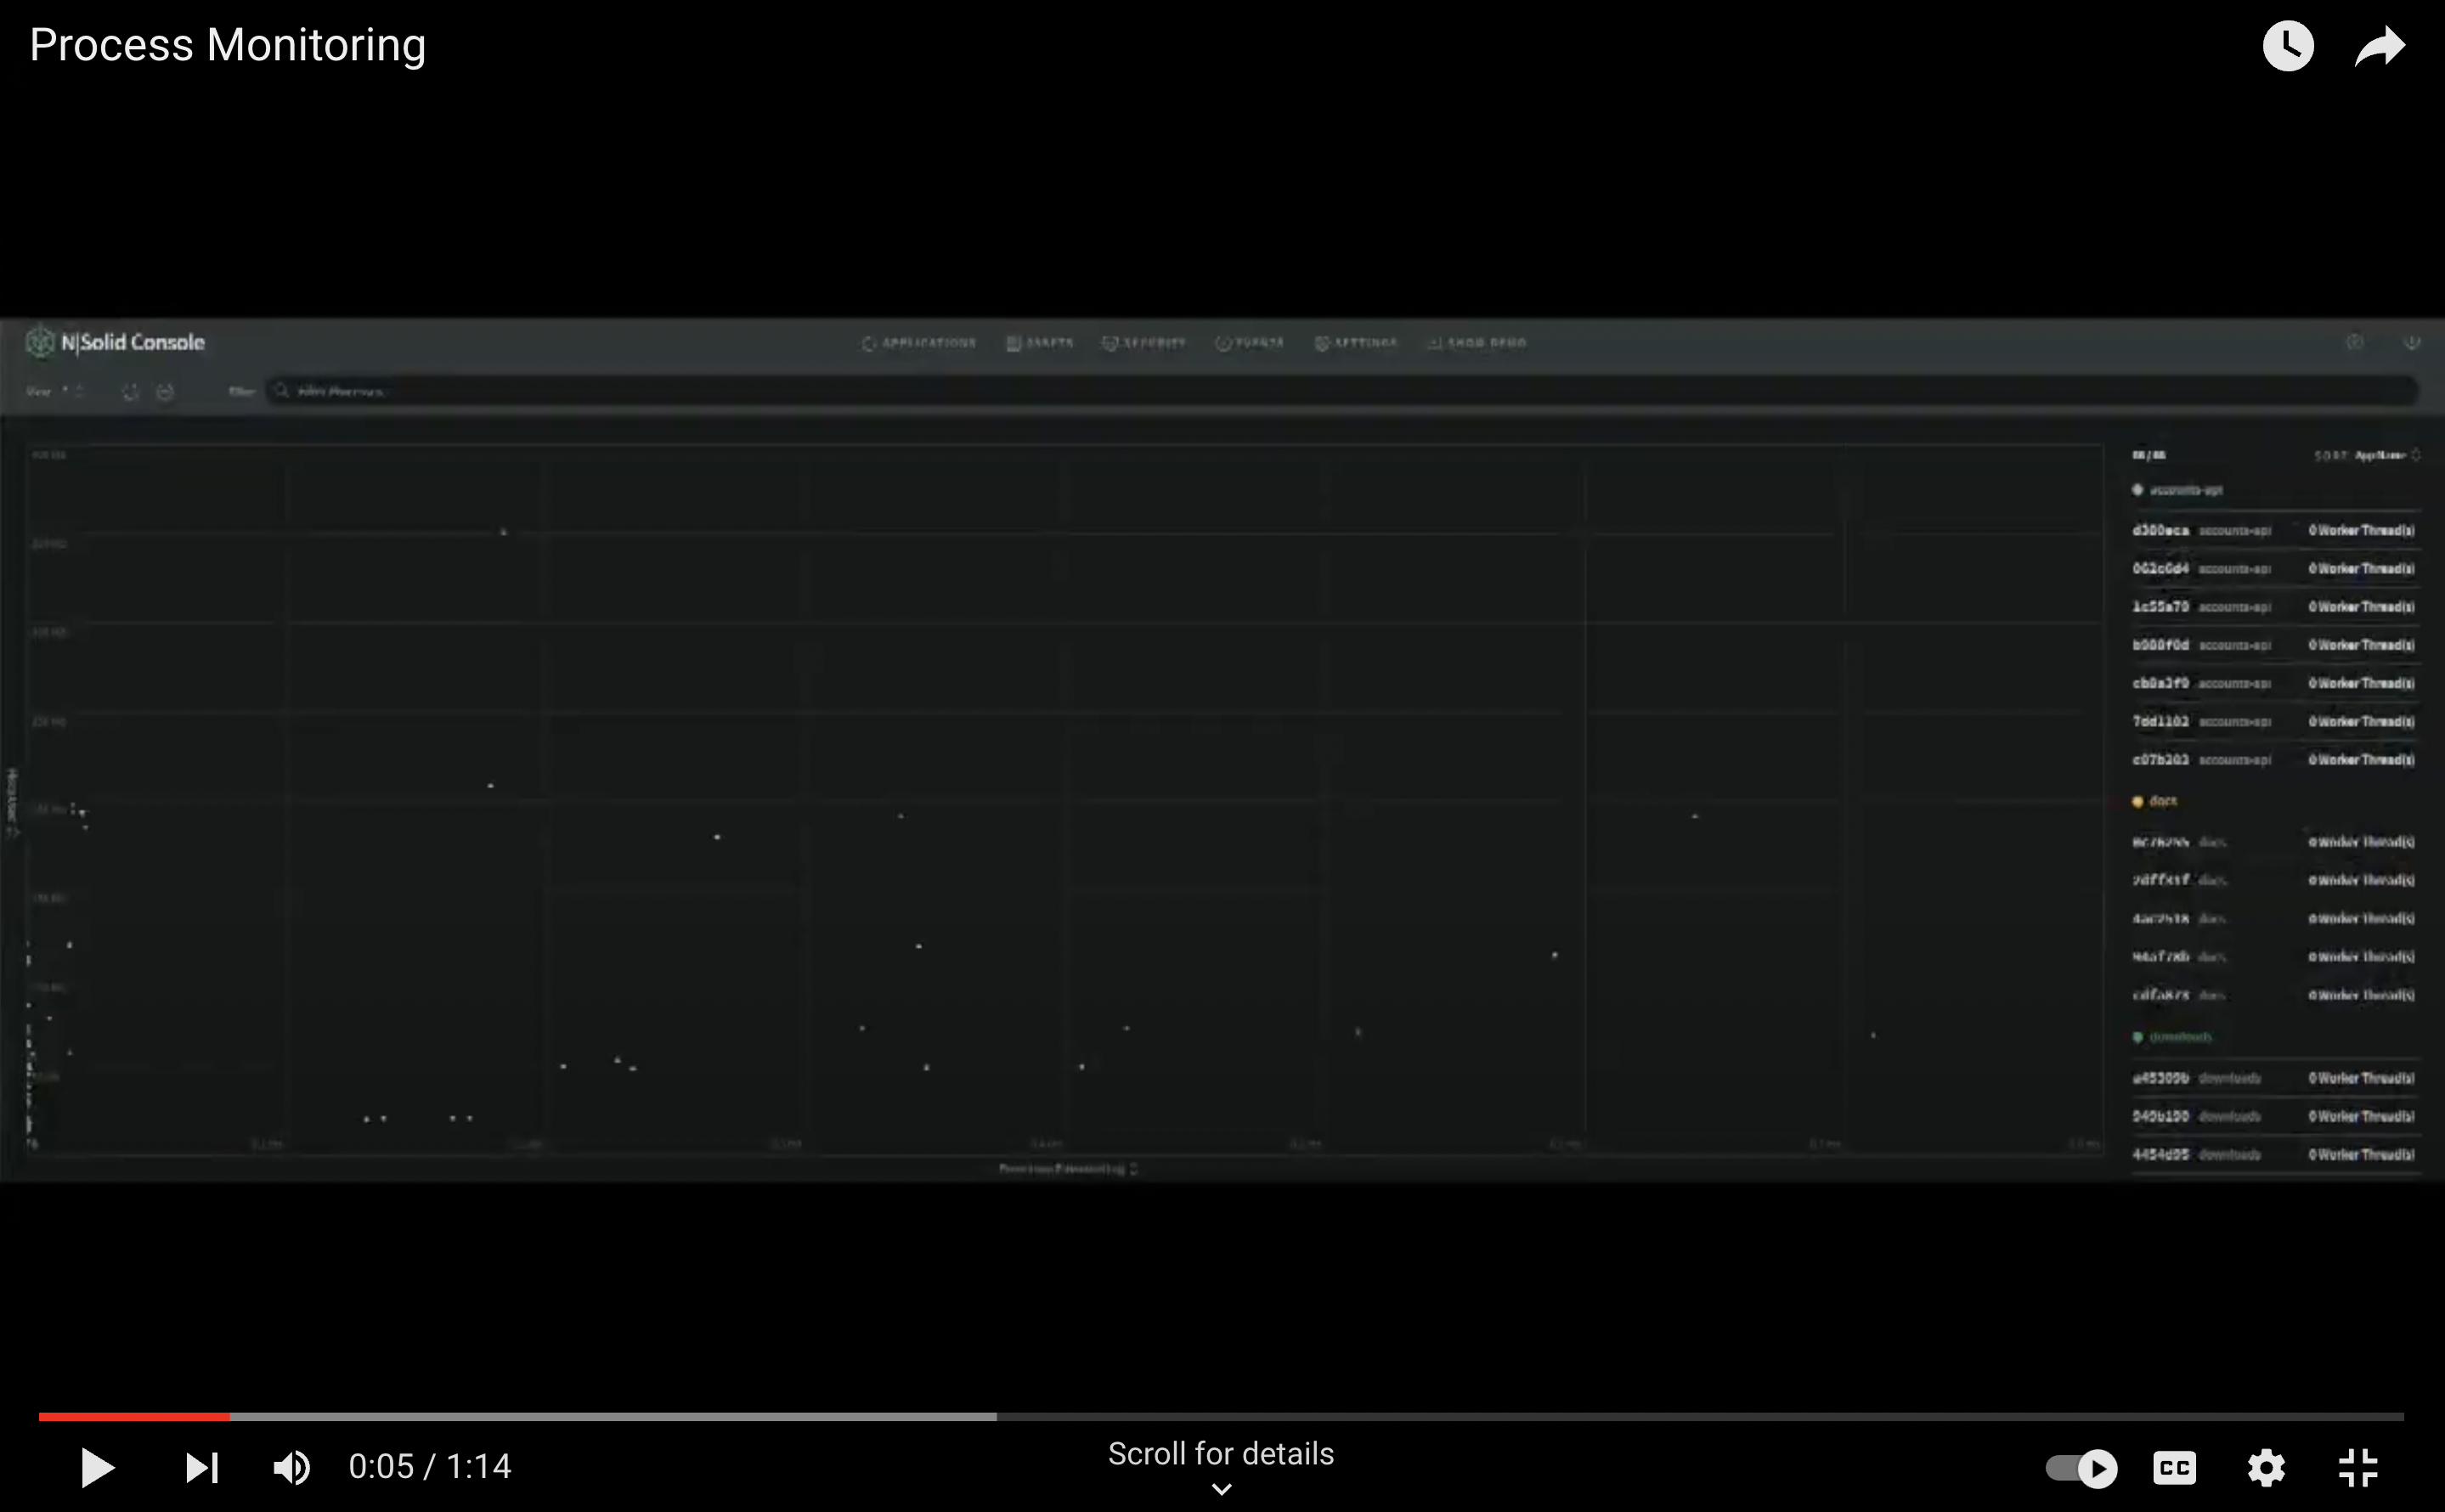
NOTE: For a better experience, you can activate the closed captions in the video, they are available in English.
When you select a specific process, we have the general status where it informs us that ten vulnerabilities have been found. And we can see the graphs by the main seven charts that measure taking the raw data.
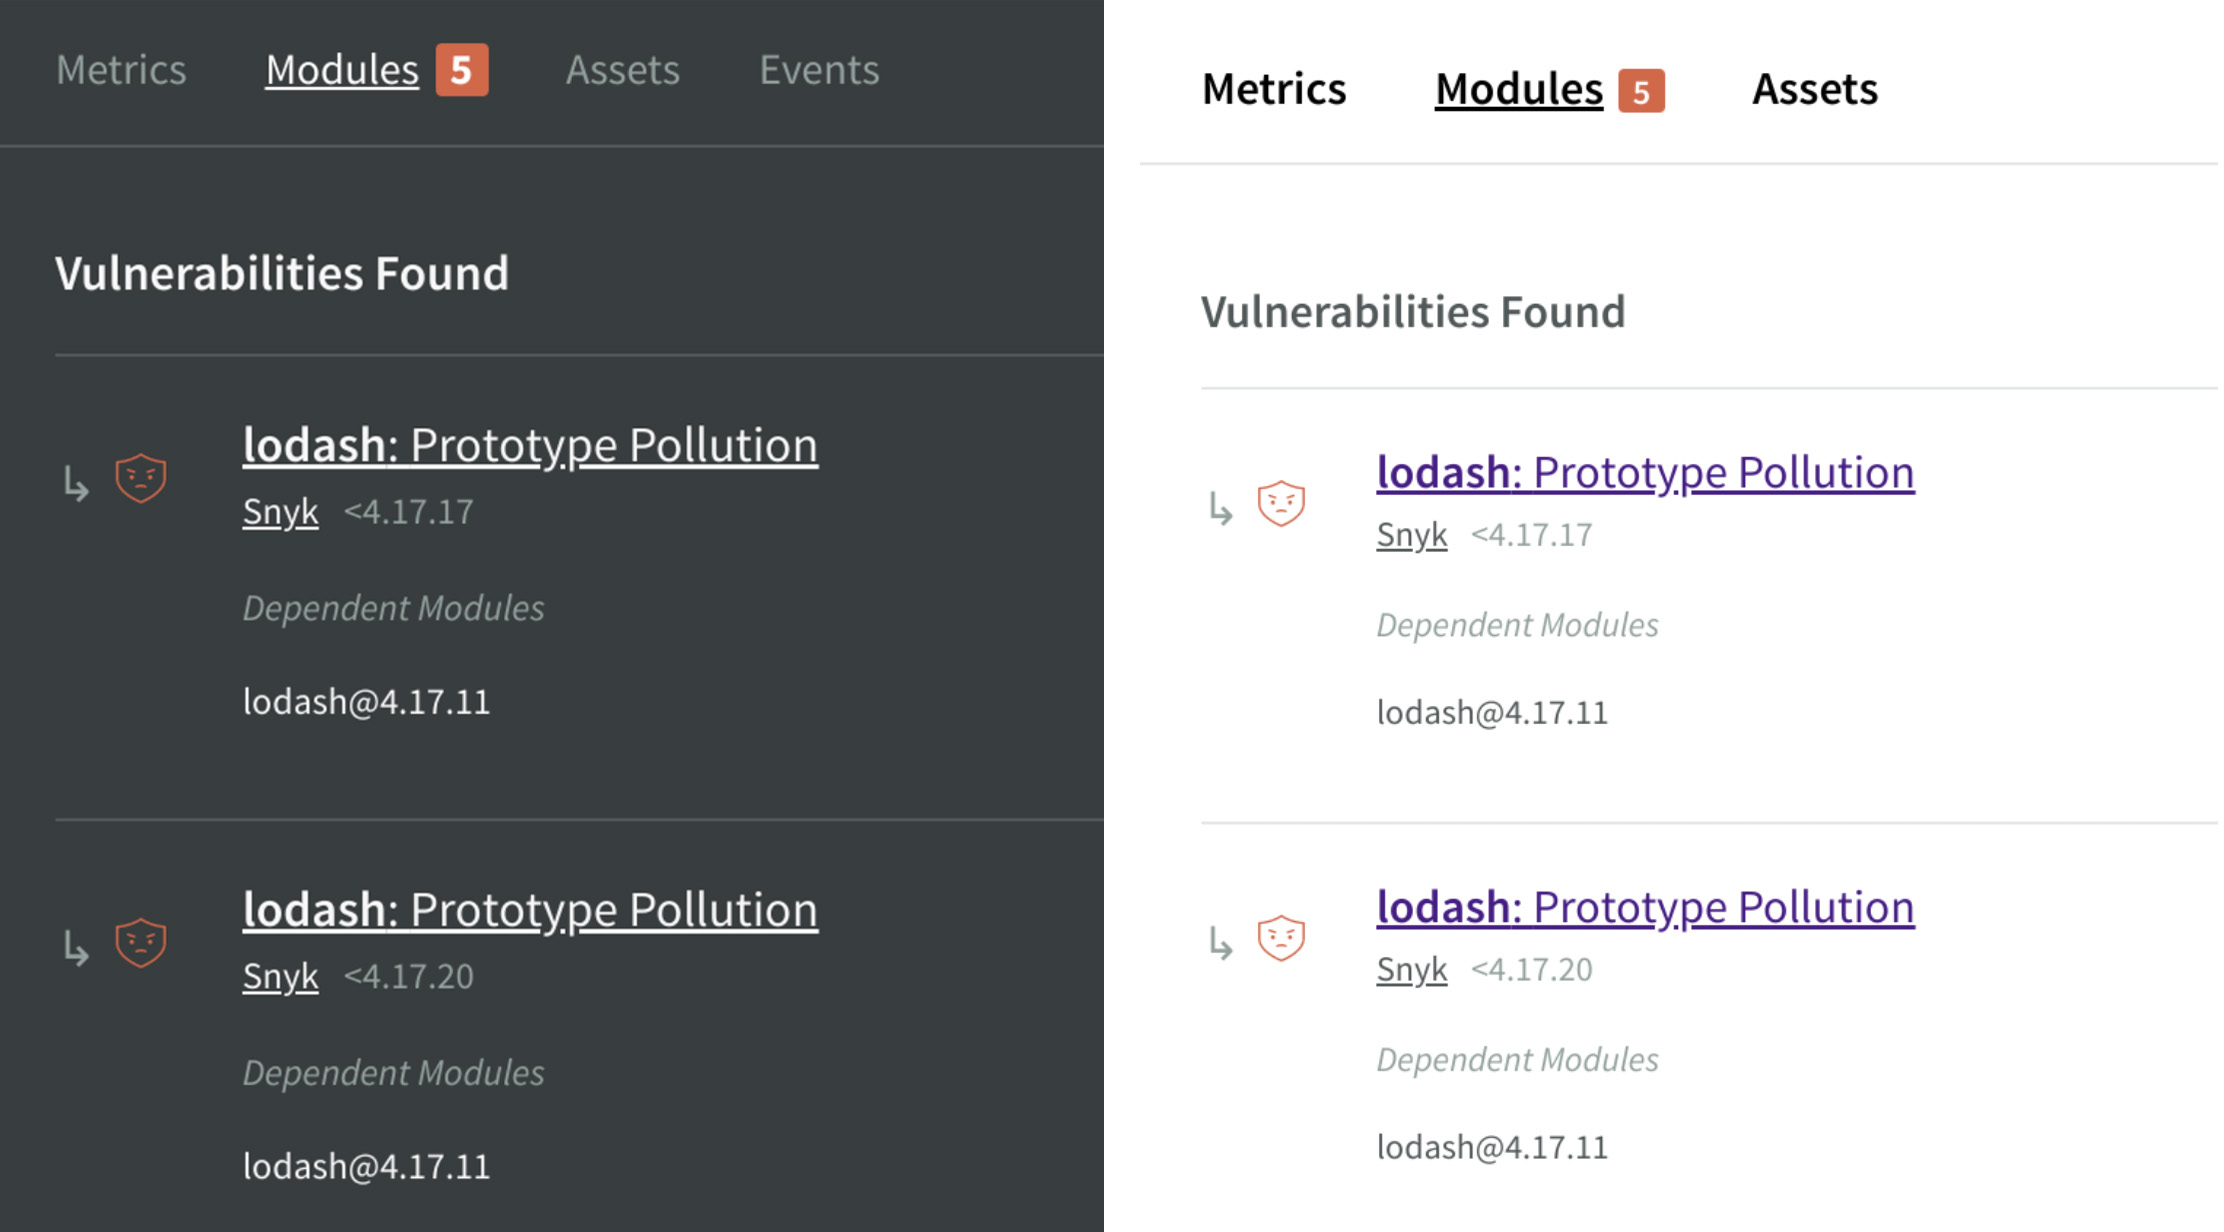 Img5 - Application Vulnerabilities (Left img) / Process Vulnerabilities (Right Img) - N|Solid
Want to try N|Solid?
Do it right now! 🏃🏿♂️🏃♀️, We release in Openjs World 2022 some codes to redeem 50% in 8 or 12 processes in our SaaS version.
50% OFF USING:
- 8 processes OPENJS-8T
- 12 processes OPENJS-12T
Or sign up for our FREE option for 4 processes and get started with N|Solid!
To check out the top 10 features and more in N|Solid, create your account in sign up or sign in, in the top right corner of our main page. More information is available here.