Capture Heap Snapshots in N|Solid [7/10] The best APM for Node, layer by layer.

How to be prepared to handle a Memory Leak
One of the first needs of developers is debugging memory-based issues in Node.js applications quickly and effectively. Still, before we jump right into the Heap Snapshot concept, it's essential to understand what a memory leak is.
A basic definition that I would apply in this context is:
'When memory is allocated but not deallocated, a memory leak occurs (the memory has leaked out of the computer). If too many memory leaks occur, they can usurp all of the memory and bring everything to a halt or slow the processing considerably.' - PCMag
Memory leaks are quite common in production applications. Fortunately, they usually aren't difficult to find.
Note: If you want to know more, we invite you to read this fantastic article ‘Memory Leaks Demystified'written by one of our Node Experts, Gio.
In short, Node memory leaks happen. Usually, they occur in production. In this scenario, it is crucial to be prepared to handle them.
Understanding Heap Usage in Node.js Applications with N|Solid
If you have a memory leak or performance issue, taking heap snapshots is a great way to help identify the underlying problem. N|Solid provides you with two ways to do this, a command-line friendly method and via our console.
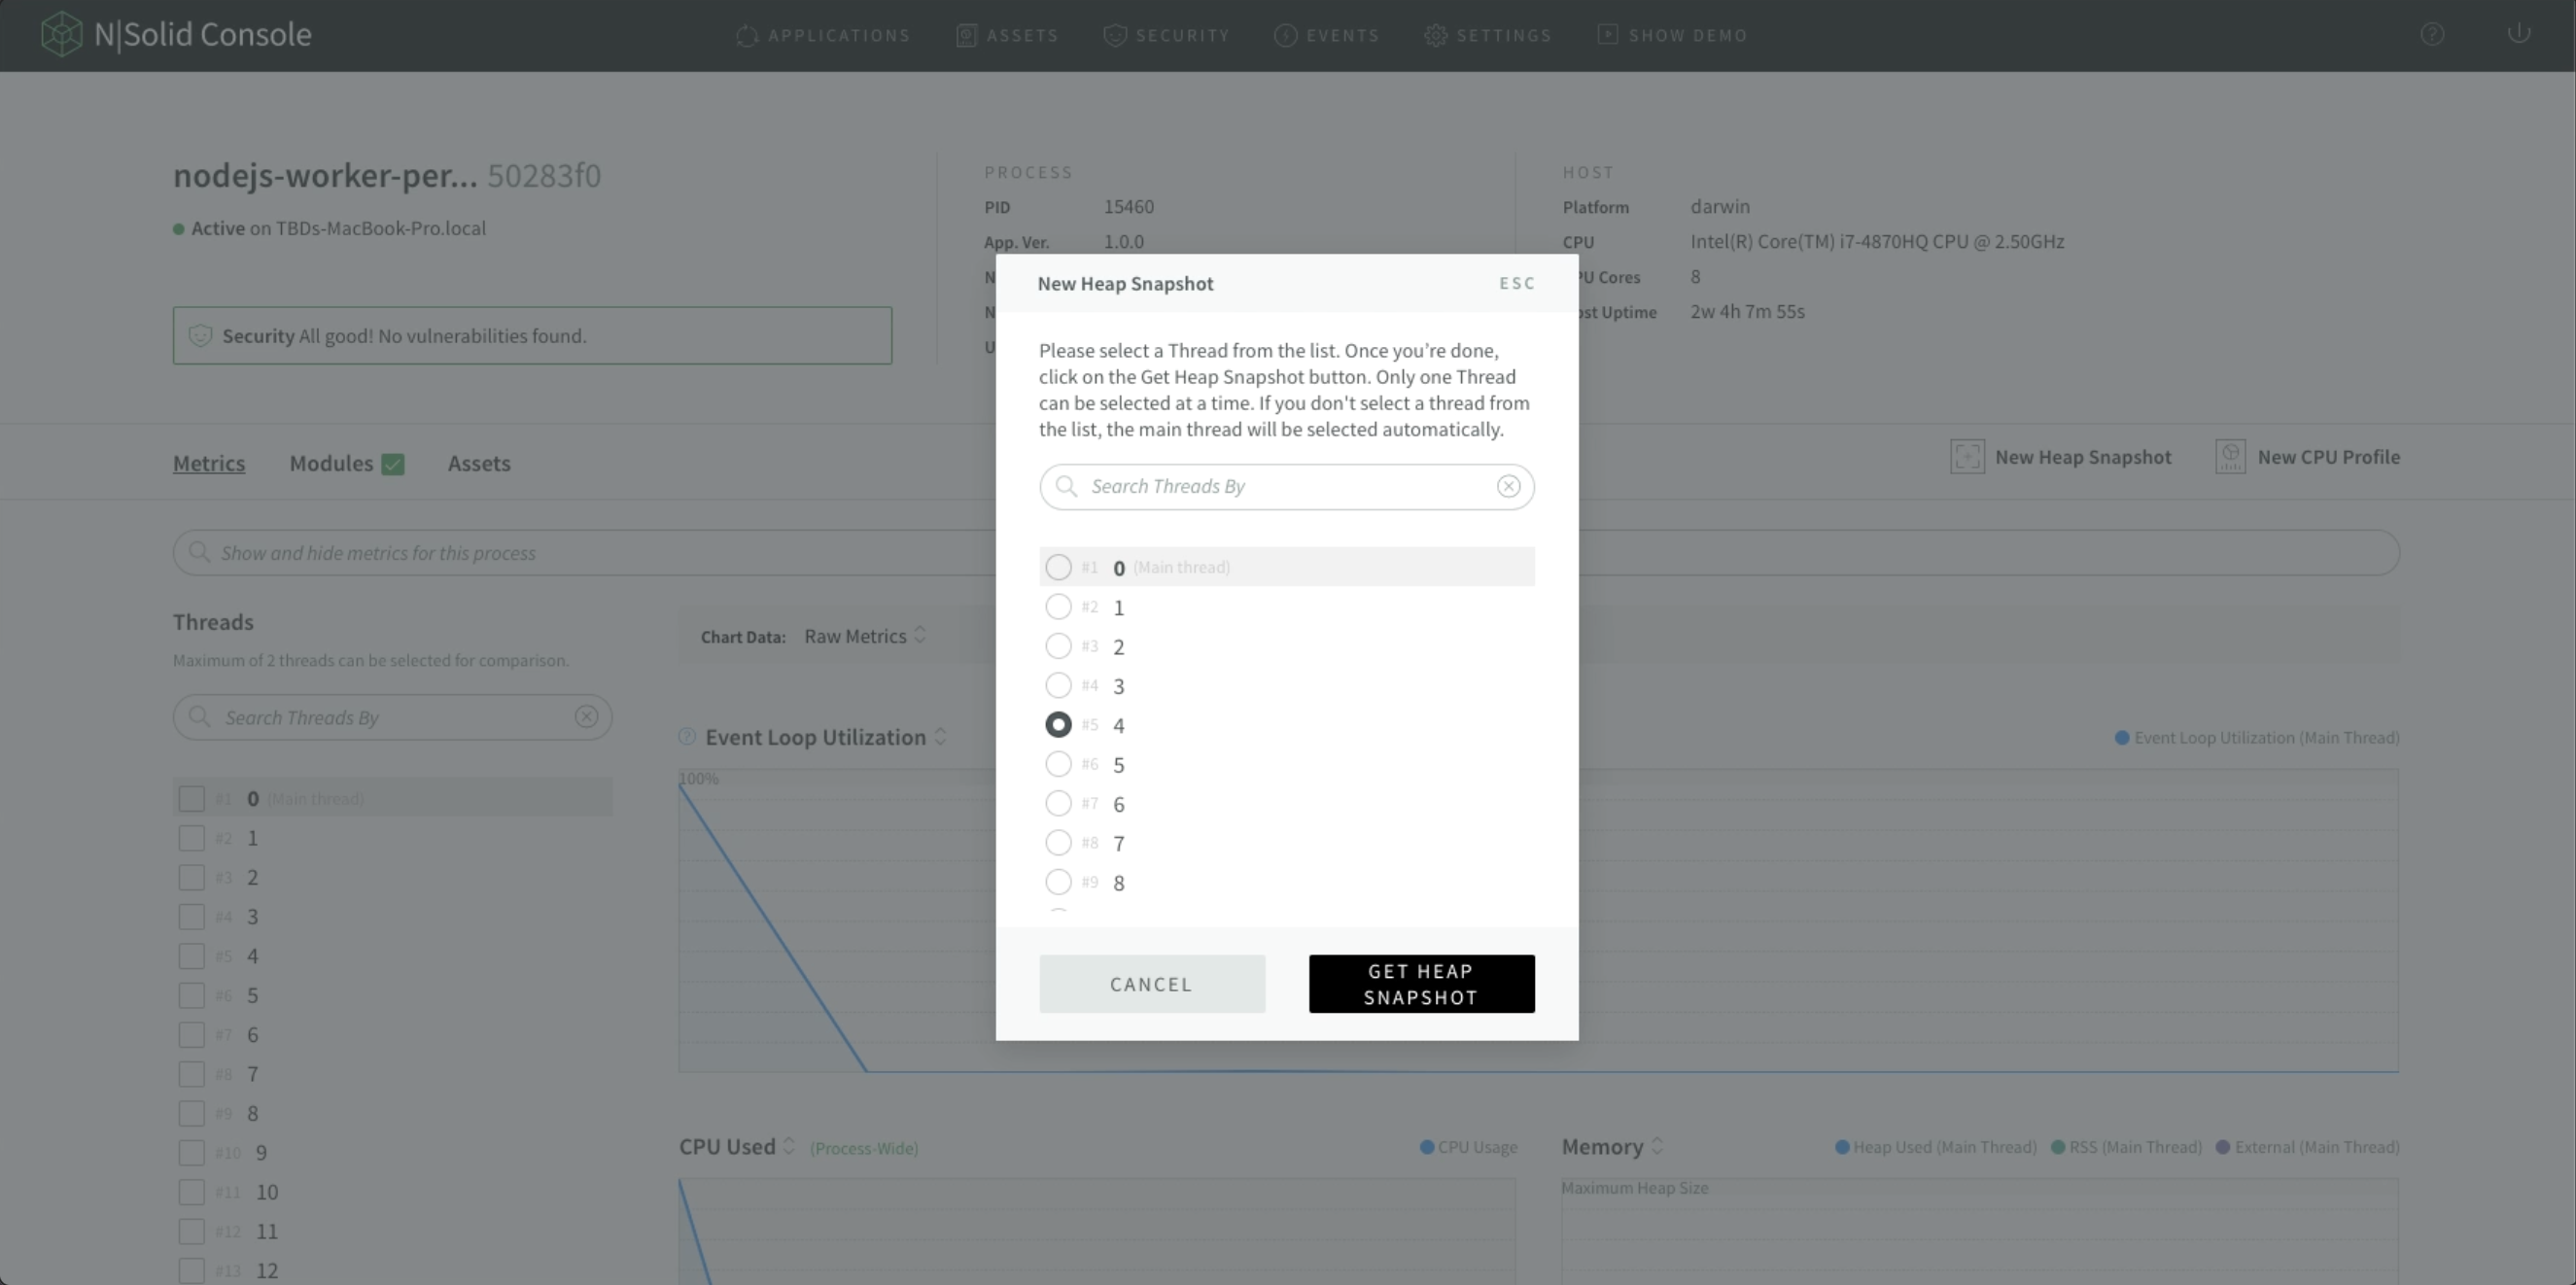 Img 1 - Capture a Heap Snapshot - N|Solid
A heap snapshot is just what it sounds like — a static snapshot of memory usage details at the moment in time — Tierney Cyren
N|Solid can help by automatically triggering heap snapshots of your Node.js applications and services in production when they're under real-world load.
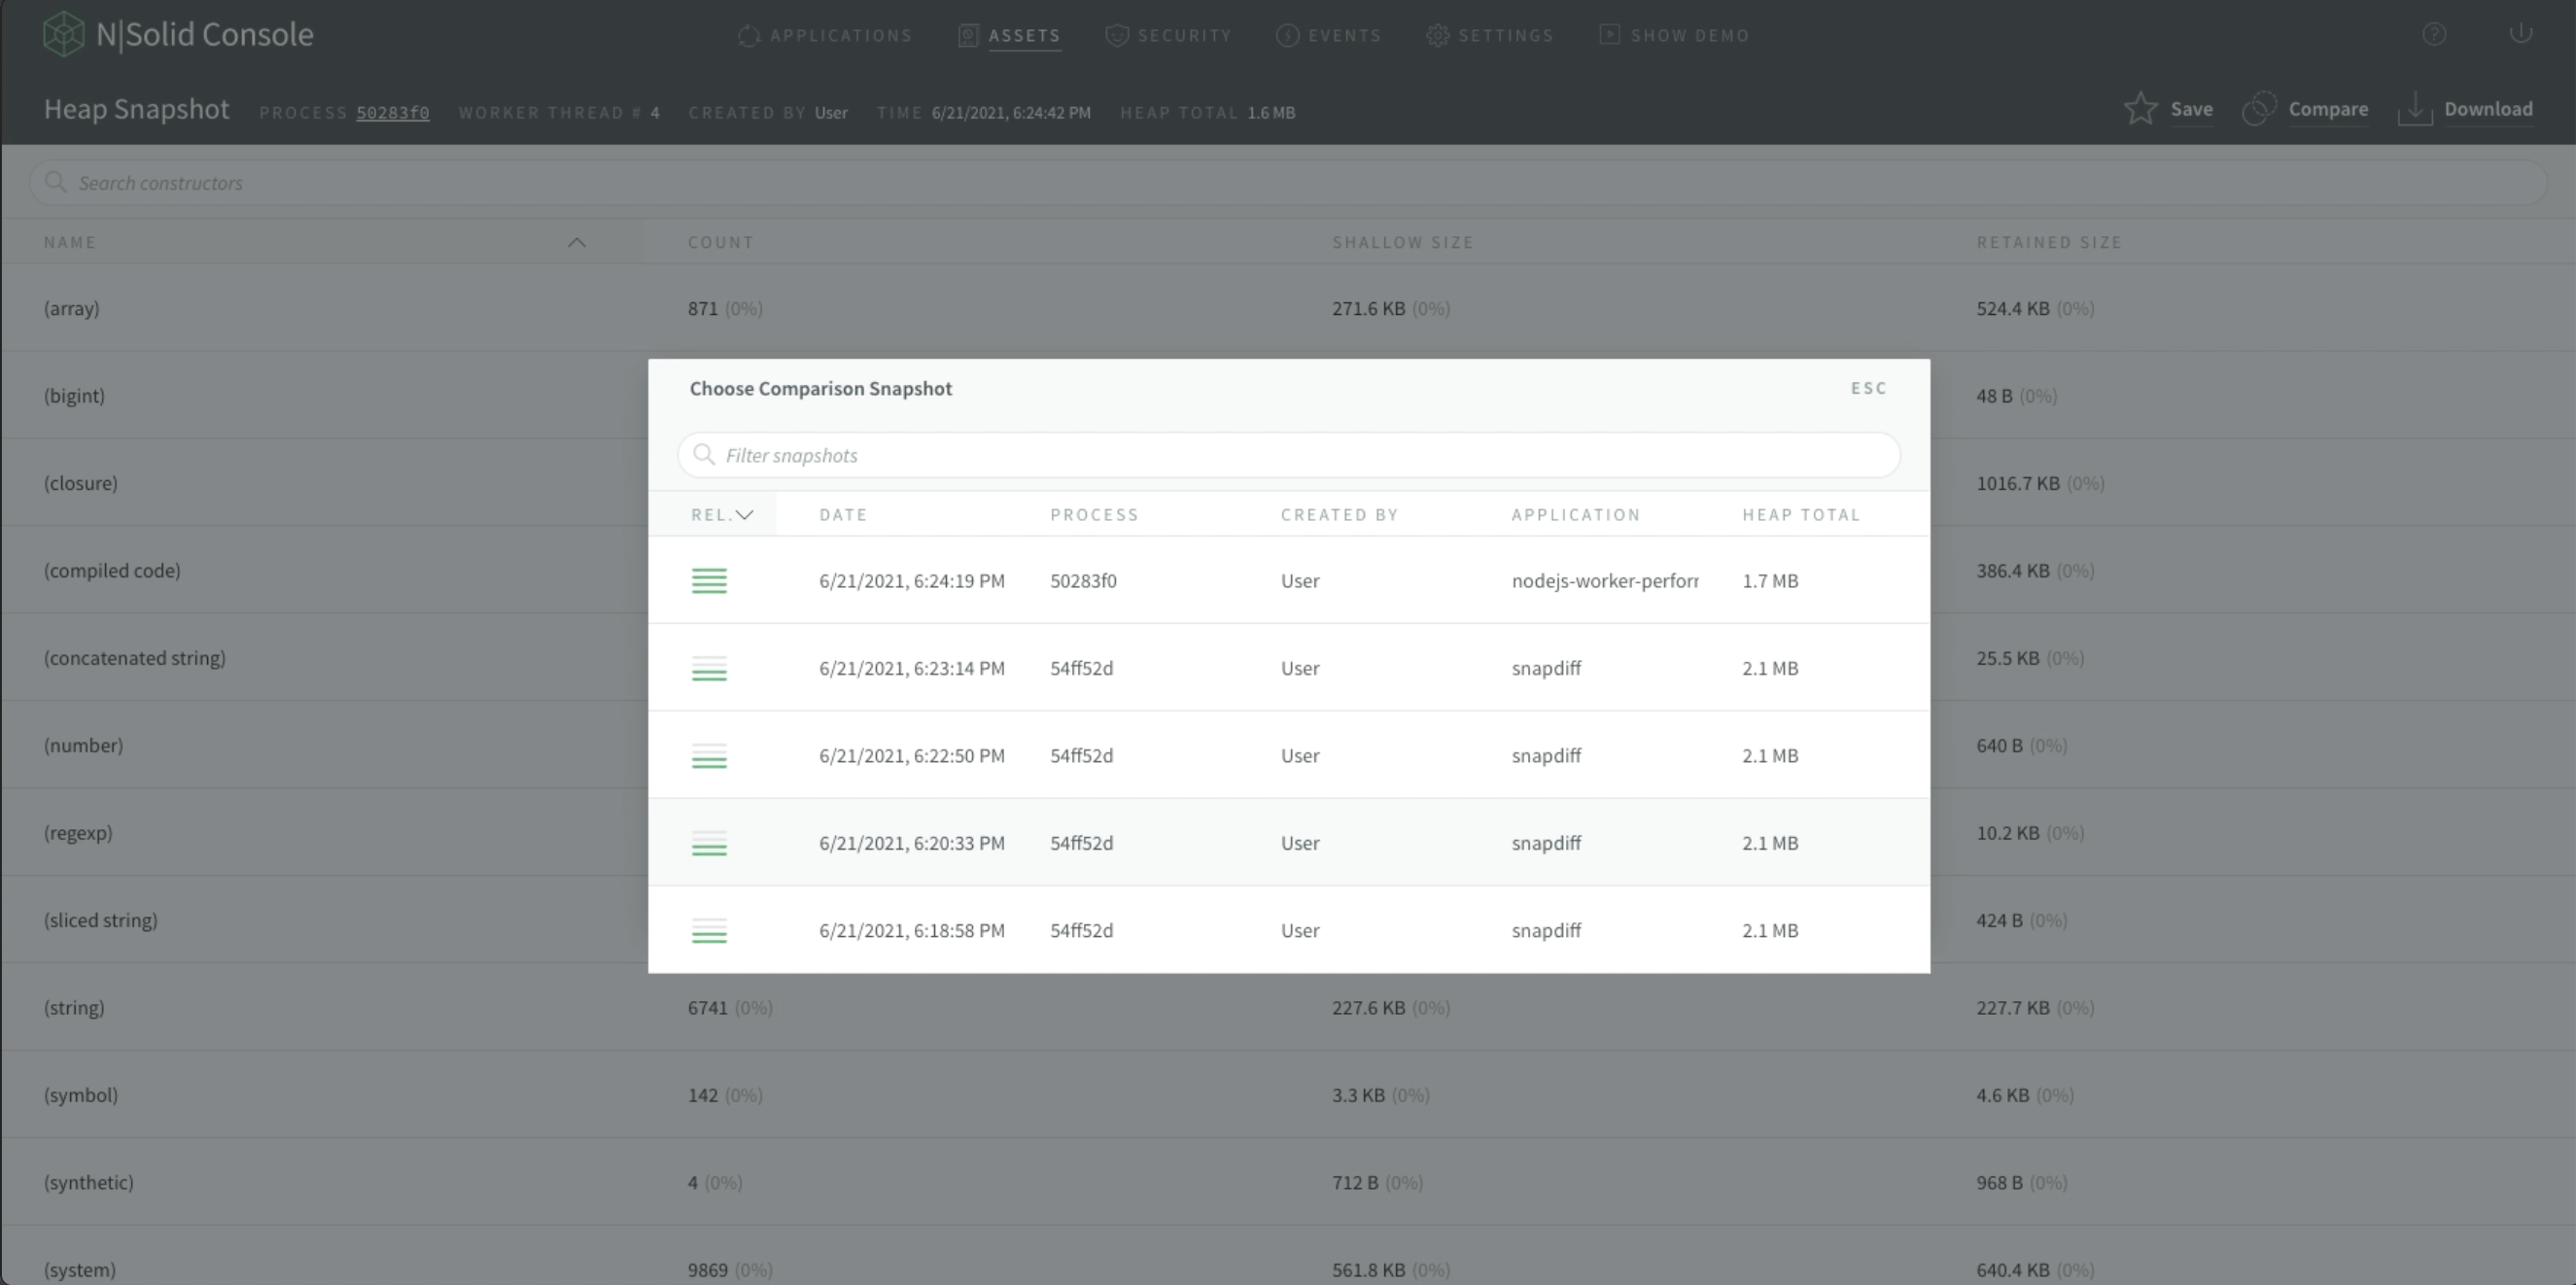 Img 2 - Compare Heap Snapshot - N|Solid
Something to have in mind is that just one heap snapshot doesn't help you understand the problem; heap snapshots are most valuable when you compare two or more of them side by side. Comparing a snapshot that lies outside the bounds of expected heap usage (when your app is misbehaving) and another snapshot showing heap usage within the expected parameters is helpful. In this sense, you will be able to see the differences and detect issues in memory usage.
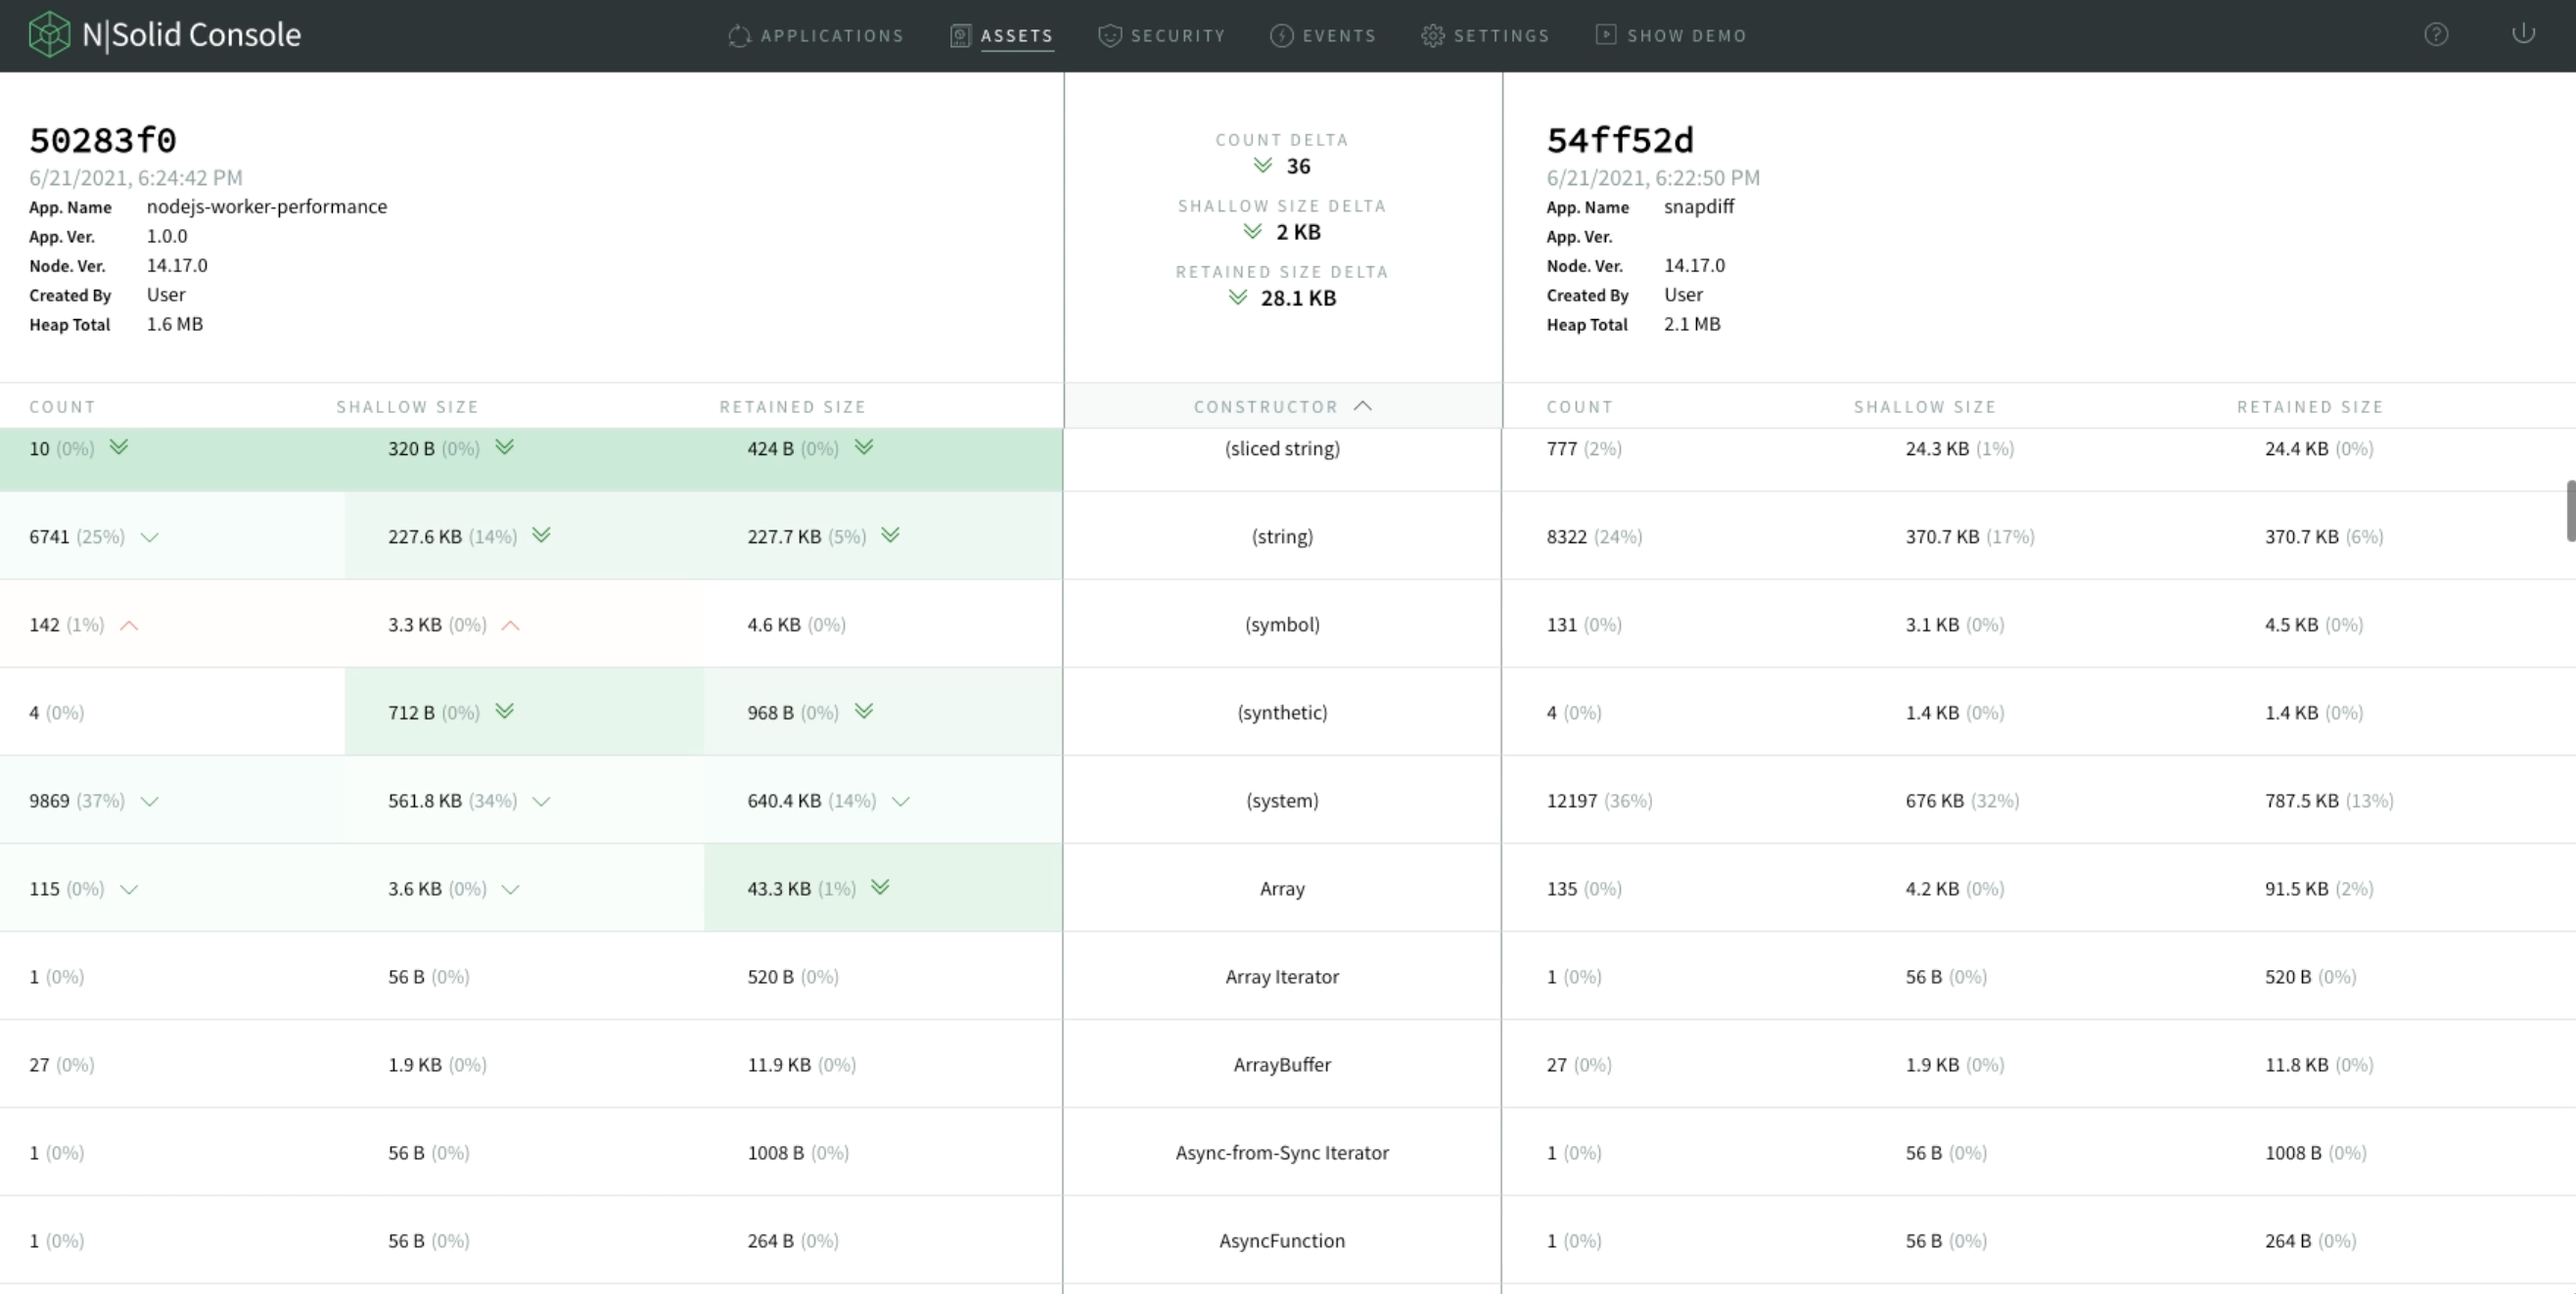 Img 3 - Detail between two Heap Snapshot - N|Solid
- Advantage: Understand where and how memory is being used.
- Benefit: Faster time to resolution for memory leaks and performance issues.
With N|Solid you can identify the underlying problem when faced with a memory leak or performance issue through Heap Snapshots.
By looking at these snapshots, you can understand where and how memory is used.
N|Solid provides several ways to capture snapshots: the N|Solid Console, the N|Solid CLI, and the N|Solid Node API.
You can compare snapshots, which makes debugging memory leaks a snap.
Demo Video — Capture Heap Snapshot in N|Solid
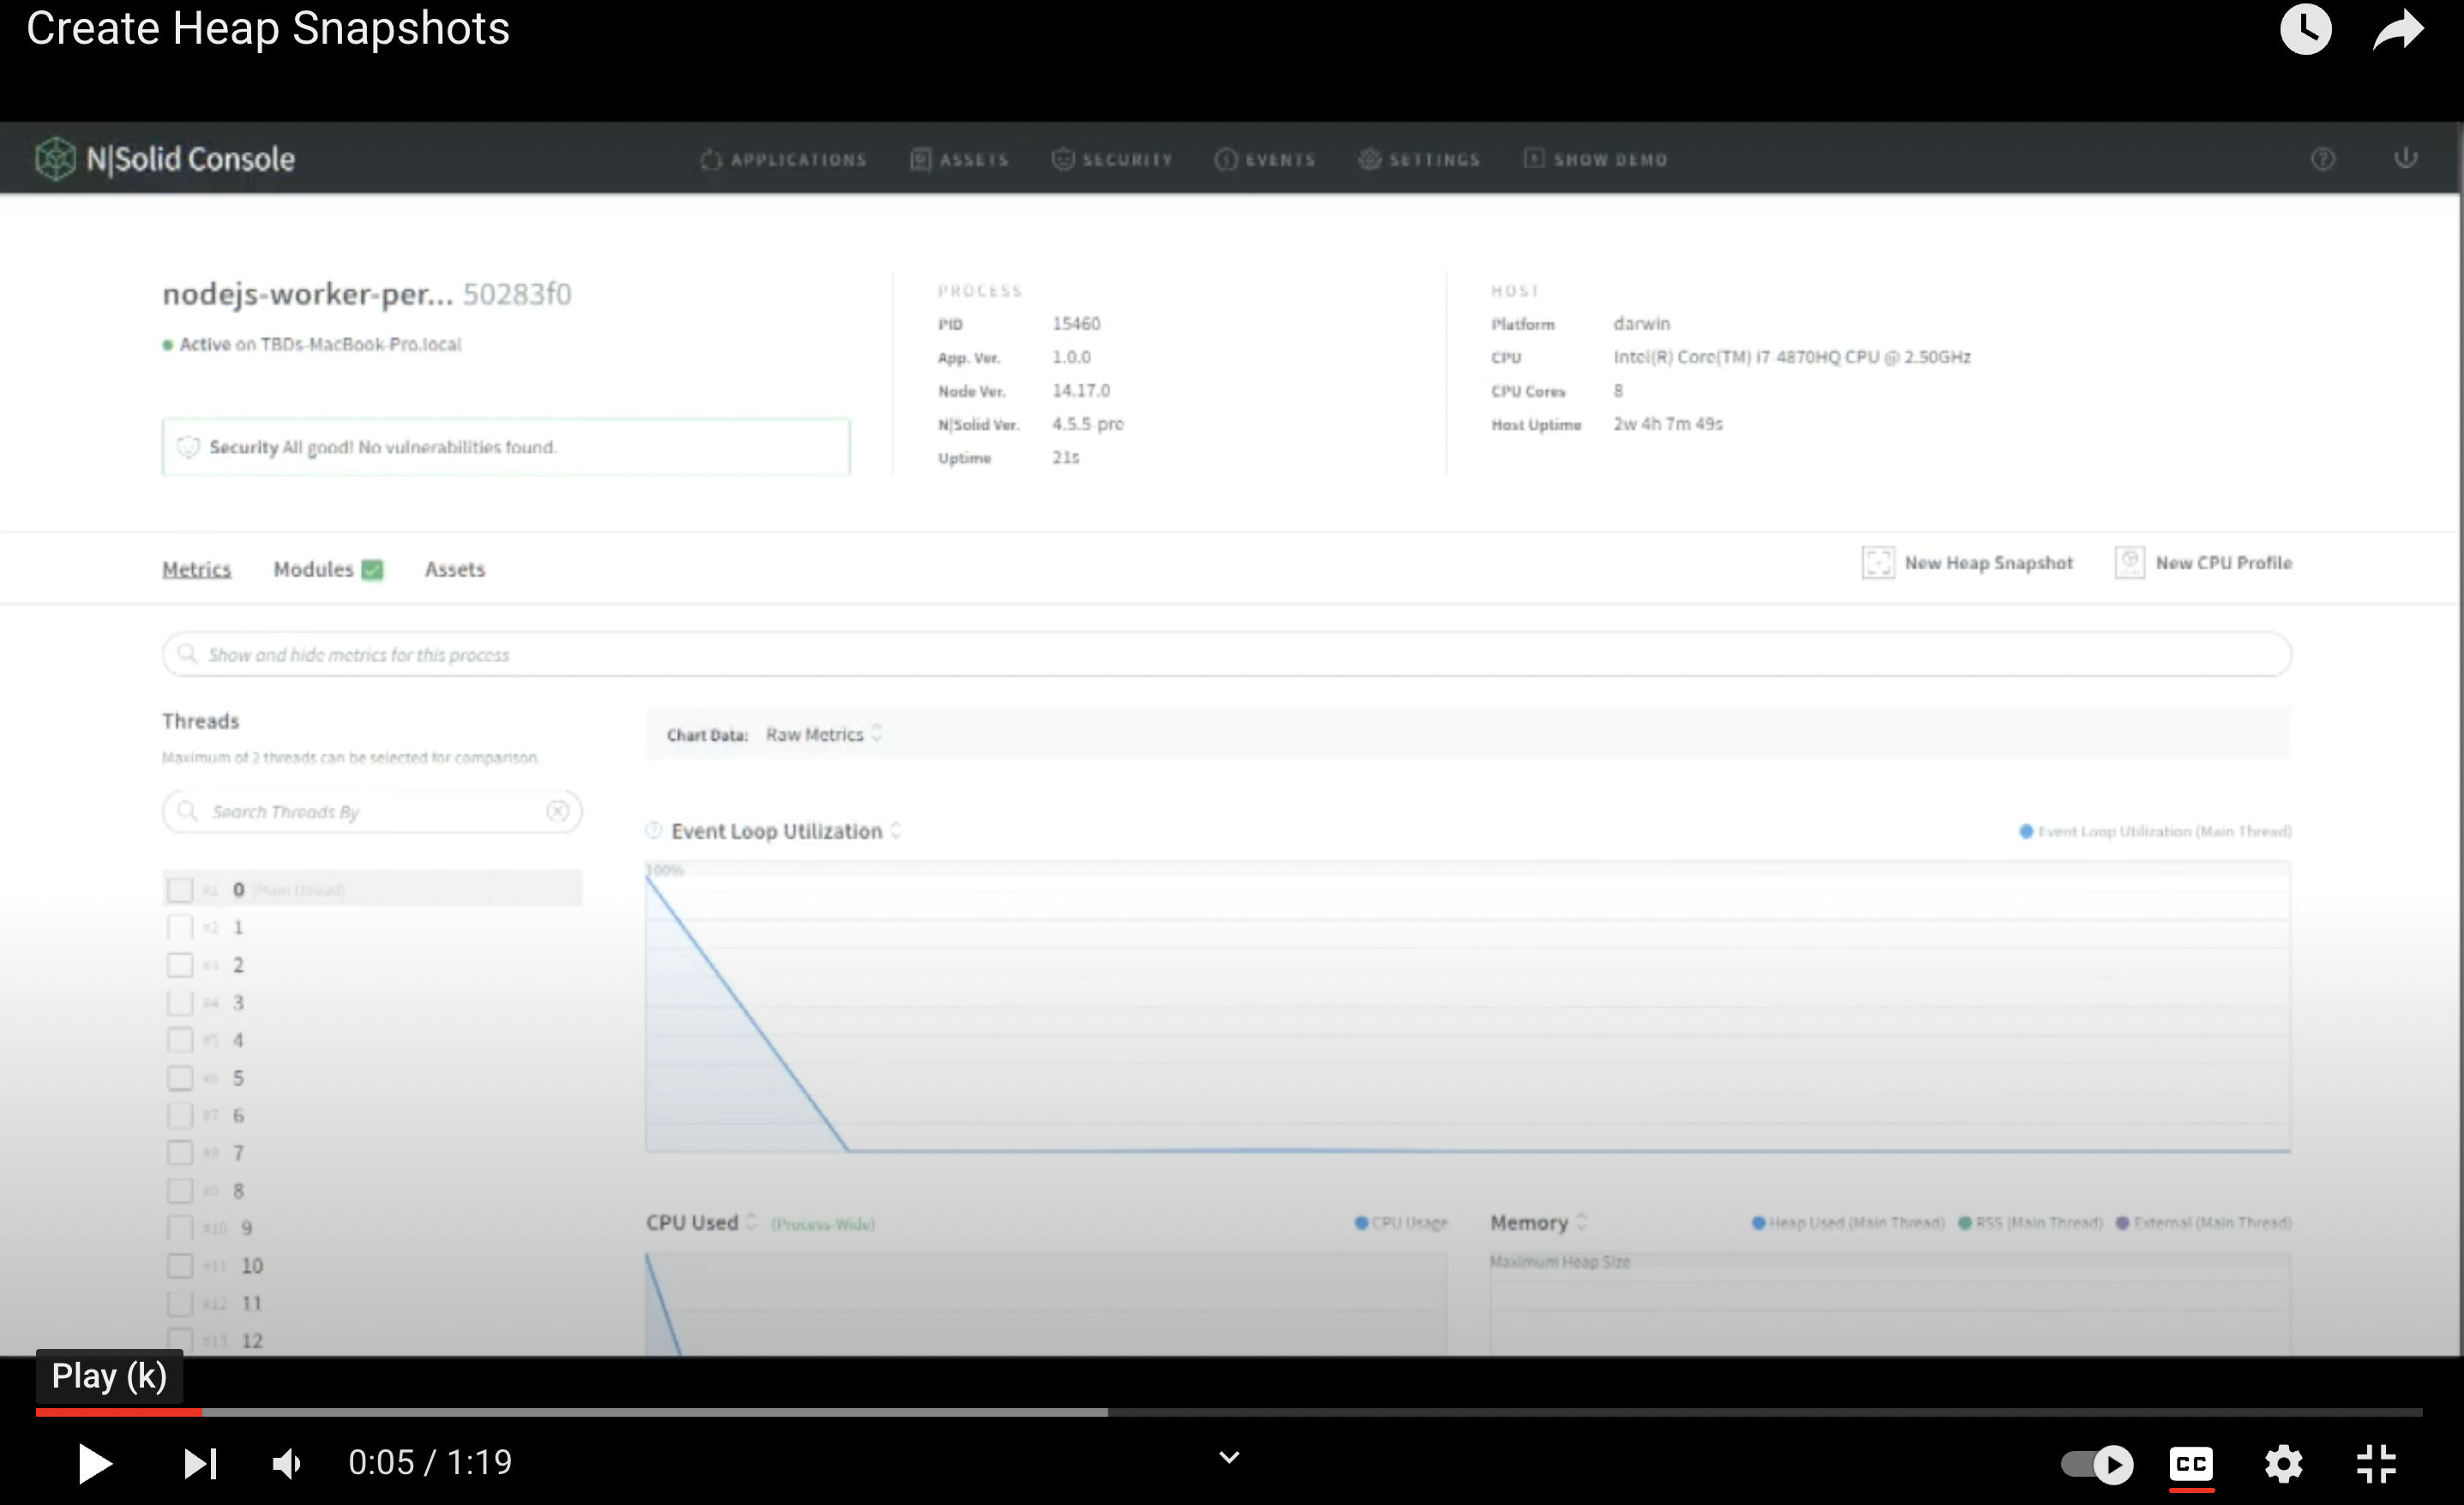 NOTE: For a better experience, you can activate the closed captions in the video. They are available in English.
We can make a Heap Snapshot of the selected Worker Thread in the process detail.
Inside the Heap Snapshot, I will find the process, the selected worker thread, the user who created it, and the Heap Total in MB. You can read more in our documentation.
Want to try N|Solid?
Do it right now! 🏃🏿♂️🏃♀️, We release in Openjs World 2022 some codes to redeem 50% in 8 or 12 processes in our SaaS version.
50% OFF USING:
- 8 processes OPENJS-8T
- 12 processes OPENJS-12T
Or sign up for our FREE option for 4 processes and get started with N|Solid!
To check out the top 10 features and more in N|Solid, sign up to create your account or sign in at the top right corner of our main page. More information is available here.