Top 10 N|Solid —APM for Node— features you needed to use

Nearly a year ago, we launched N|Solid SaaS, and although there are still a few months to go before our anniversary, we wanted to share the top 10 features ofN|Solid that make us proud every day of what we have built.
N|Solid is the best way to monitor and secure your Node.js applications (including in production) that are trusted by developers, software teams, and global enterprise companies. It has an array of features like other APMs, but we go deeper with our insights and are more performant than all others. We created N|Solid to help companies build the best software with Node and save time resolving issues. Because there is significant risk in deploying open-source applications without knowing the security gaps, we provide features to prevent security issues and insights for resolving them.
We are confident we're the best APM solution for Node. js-based applications; if you are using Node, you should be using our runtime. We're a complete product/solution, not just an APM focused on Node.
About N|Solid
N|Solid is a toolset built on Node.js that provides a number of enhancements to improve troubleshooting, debugging, managing, monitoring, and securing your Node.js applications. It is 100% compatible with the open-source project and requires no instrumentation of your code.
N|Solid Console
N|Solid provides a web-based console, ‘N|Solid Console’ to monitor your applications but also allows you to introspect your Node.js applications, in the same way, directly in the CLI if you run the N|Solid Runtime.
N|Solid Runtime
If you want to introspect your Node.js applications and have the most control from your command line, you'll run them with the N|Solid Runtime, which is shaped similarly to a typical Node.js runtime but provides some additional executables.
To install N|Solid Runtime, download and unpack an N|Solid Runtime from the N|Solid download site.
Why N|Solid is an APM
Traditionally, the acronym APM has been used to refer to application performance management. However, in recent years it also refers, perhaps more correctly, to Application Performance Monitoring, and that is exactly what N|Solid does, which is why its categorization in this spectrum of applications is correct. Something important to highlight is that it is not a polyglot APM; it is clearly an APM specialized in Node.js, which has always been our focus.
While other APMs support Node.js, none provide the level of insights N|Solid can. In many cases, the APMs can become a part of the problem by consuming significant resources due to how they are designed. But don't take our word for it. You can check it with real data through this OS Project — The APM's Benchmark tool —.
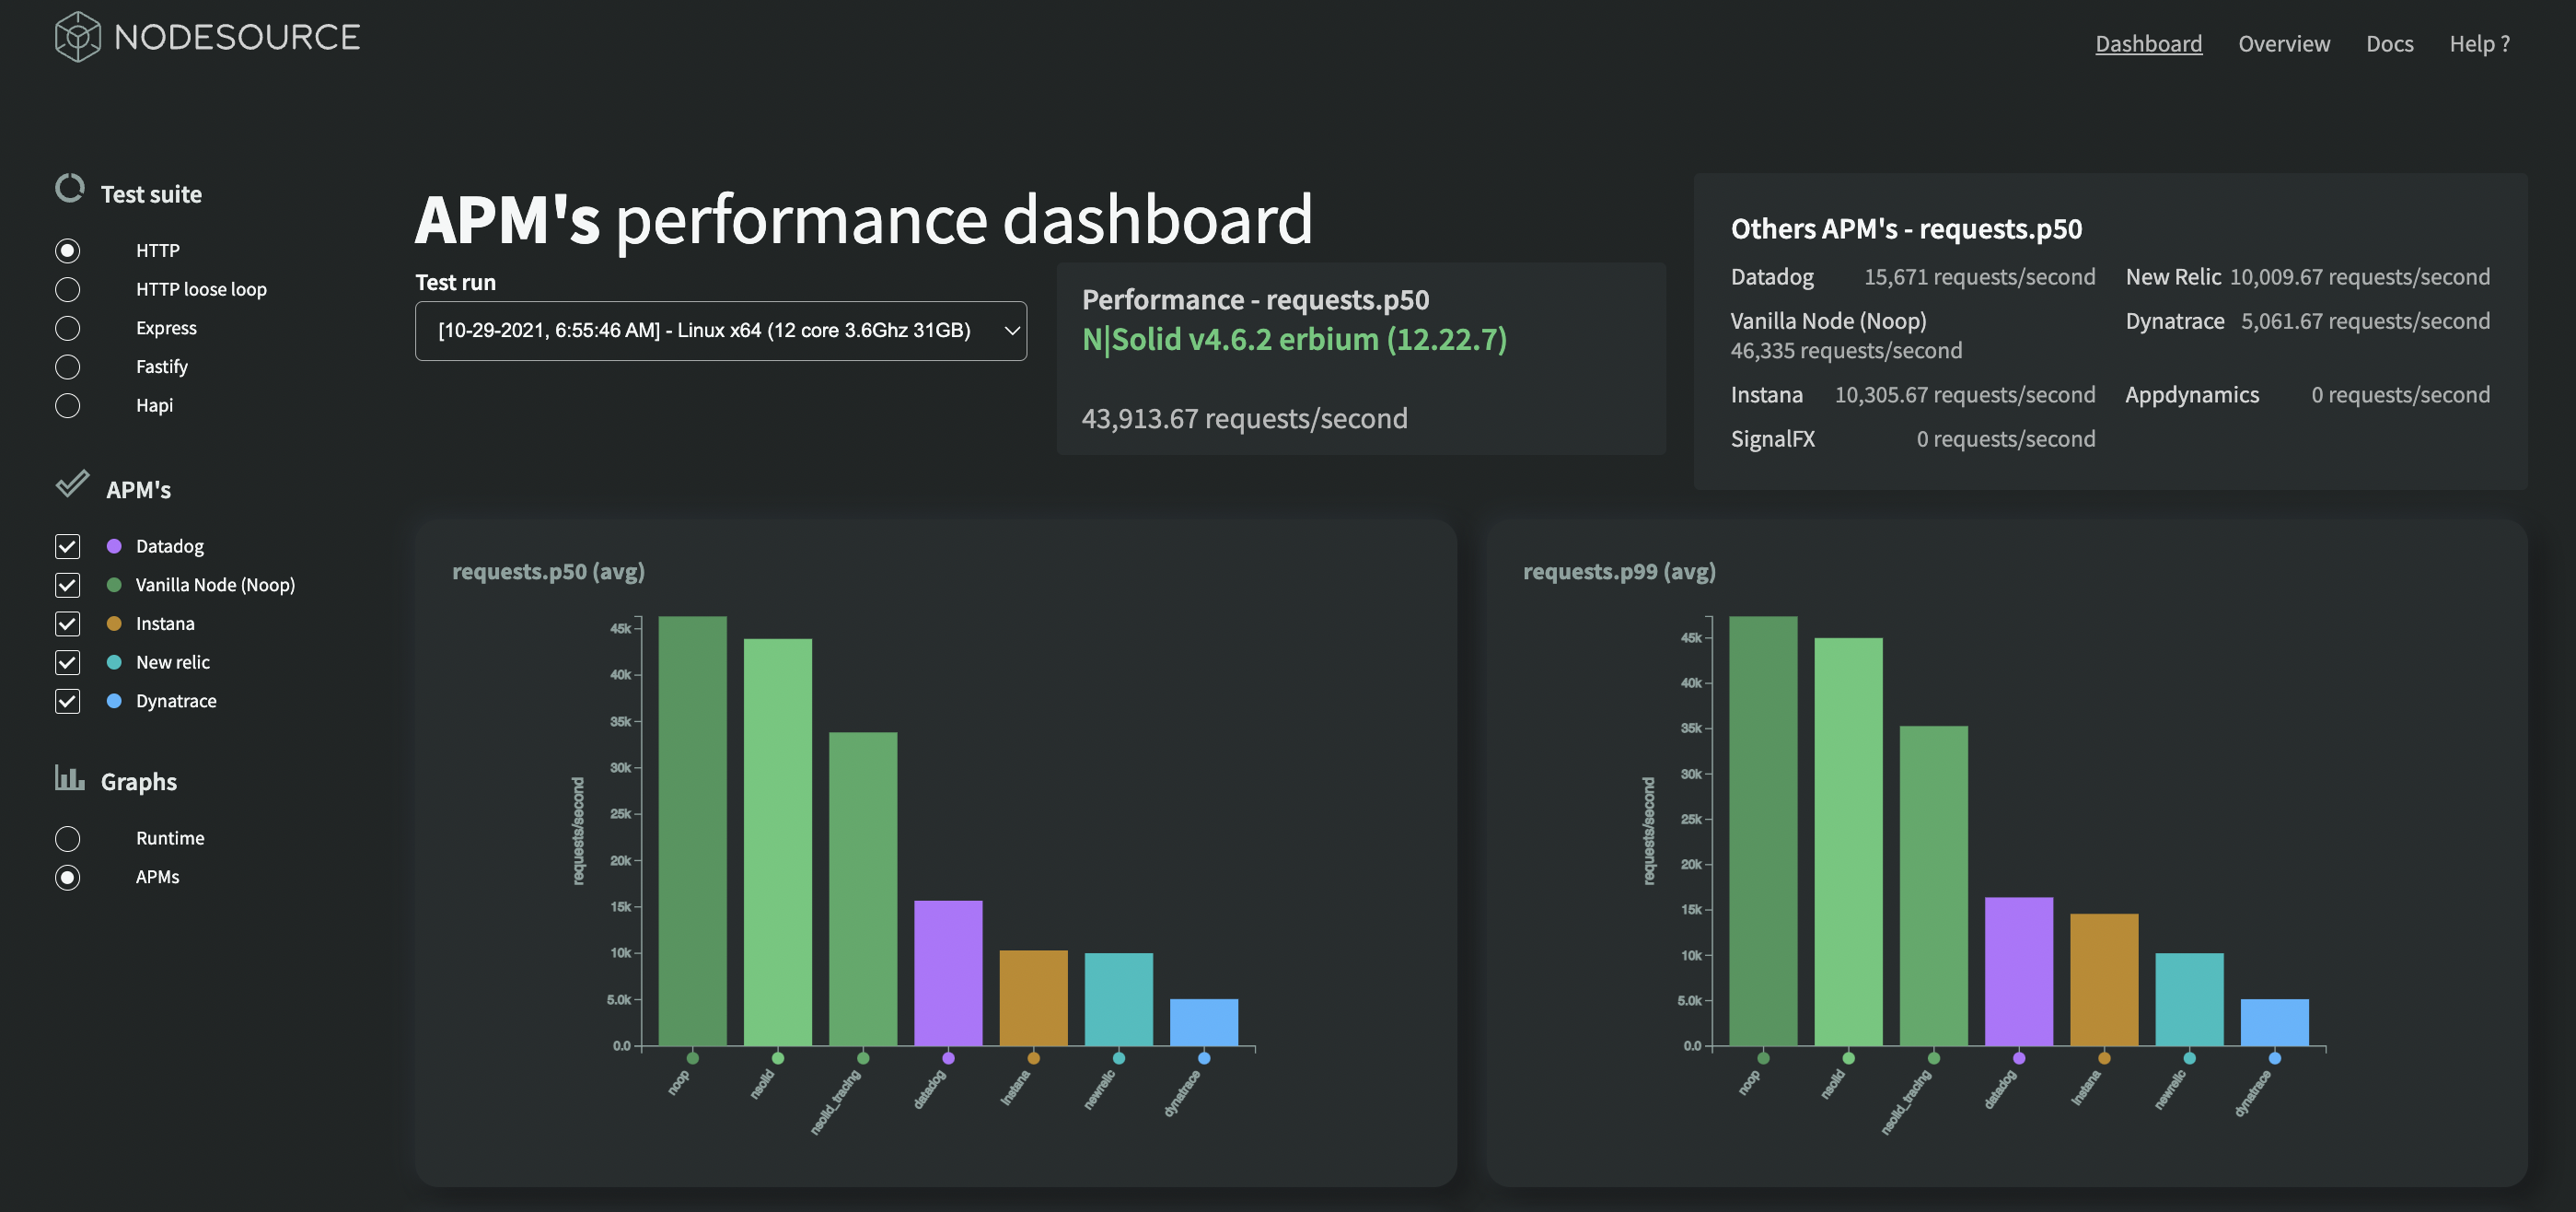
APM’s Benchmark Tool - Overview Screen
N|Solid APM (Self-hosted or SaaS) is the best observability and insights tool to manage Node performance and security, and the full platform access enables you to really #KnowyourNode
In this blog post, we want to wrap it up our product series, briefly telling you about the 10 main features of N|Solid. We hope you like it and it helps you get the most out of our product.
[1] Project & Applications Monitoring in N|Solid
Visually view application behavior and identify performance and security issues.
With Project & Application Monitoring, you can track a website or any application based on Node.js. This feature allows you to collect your log data to help developers detect bugs and process use, track downtime, and improve performance to be consistent and focused on the end-user experience.
N|Solid APM - Projects & Applications View
This area is mainly made up of 3 main views that use the Projects and Applications and Process Monitoring:
- Applications view
- Application summary view
- Processes view
Read more about this feature here: https://nsrc.io/ProjectApplicationsMonitoringNS
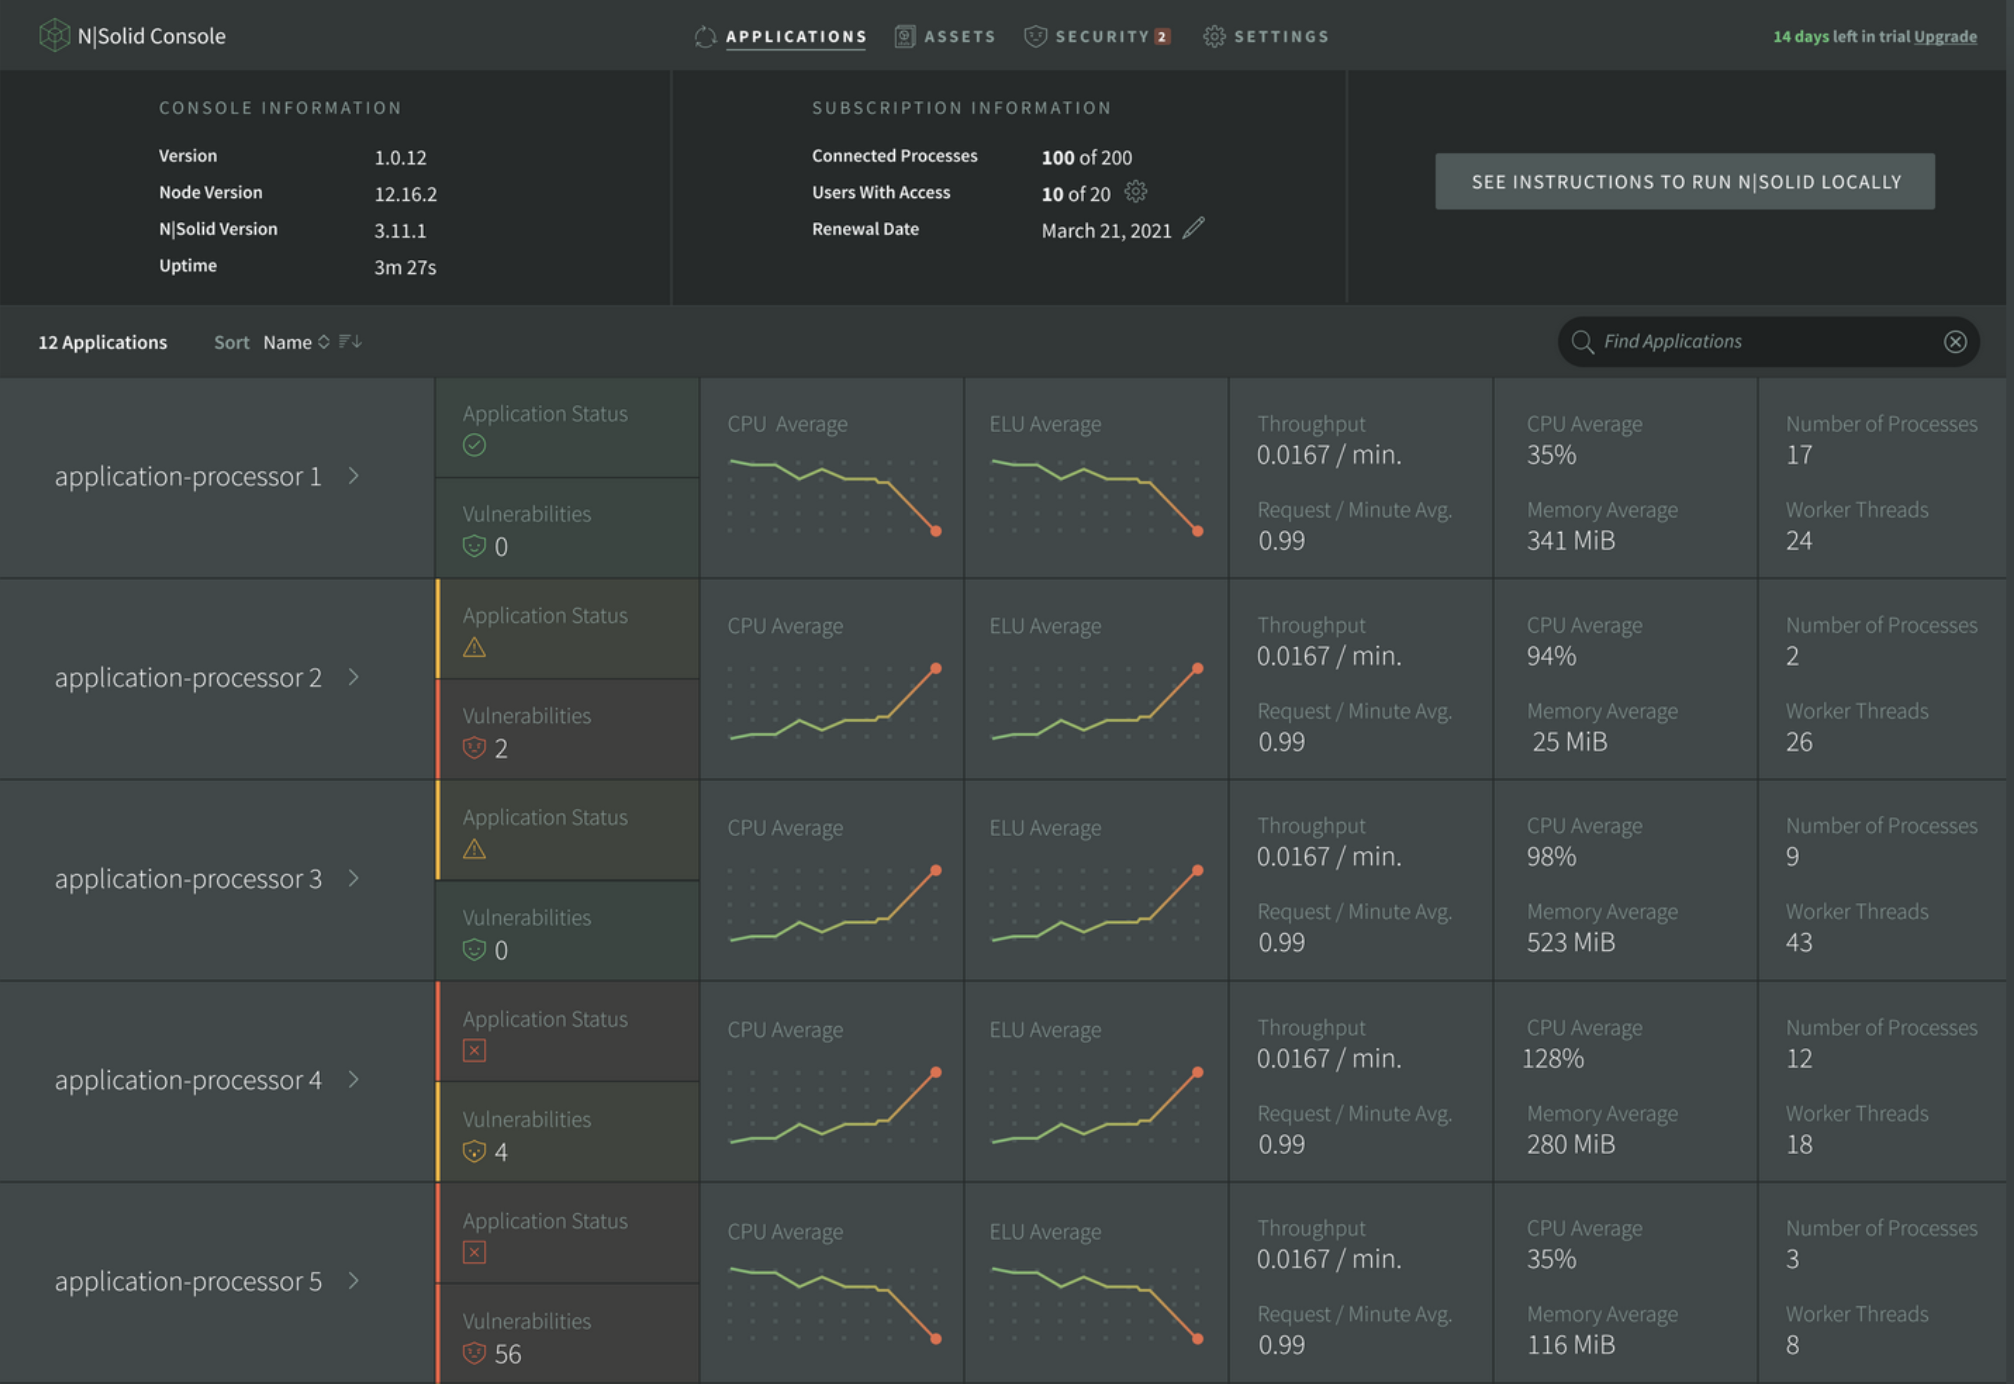
[2] Process Monitoring in N|Solid
Access deep performance insights.
The applications and associated processes are displayed in this feature of our N|Solid Console. You can visualize Event Loop Estimated Lag, Heap Used, or CPU Used, for example, and you can correlate these metrics in a planimetry. You can also select a specific process to know its general status and vulnerabilities and choose a specific graphic to visually represent the selected information.
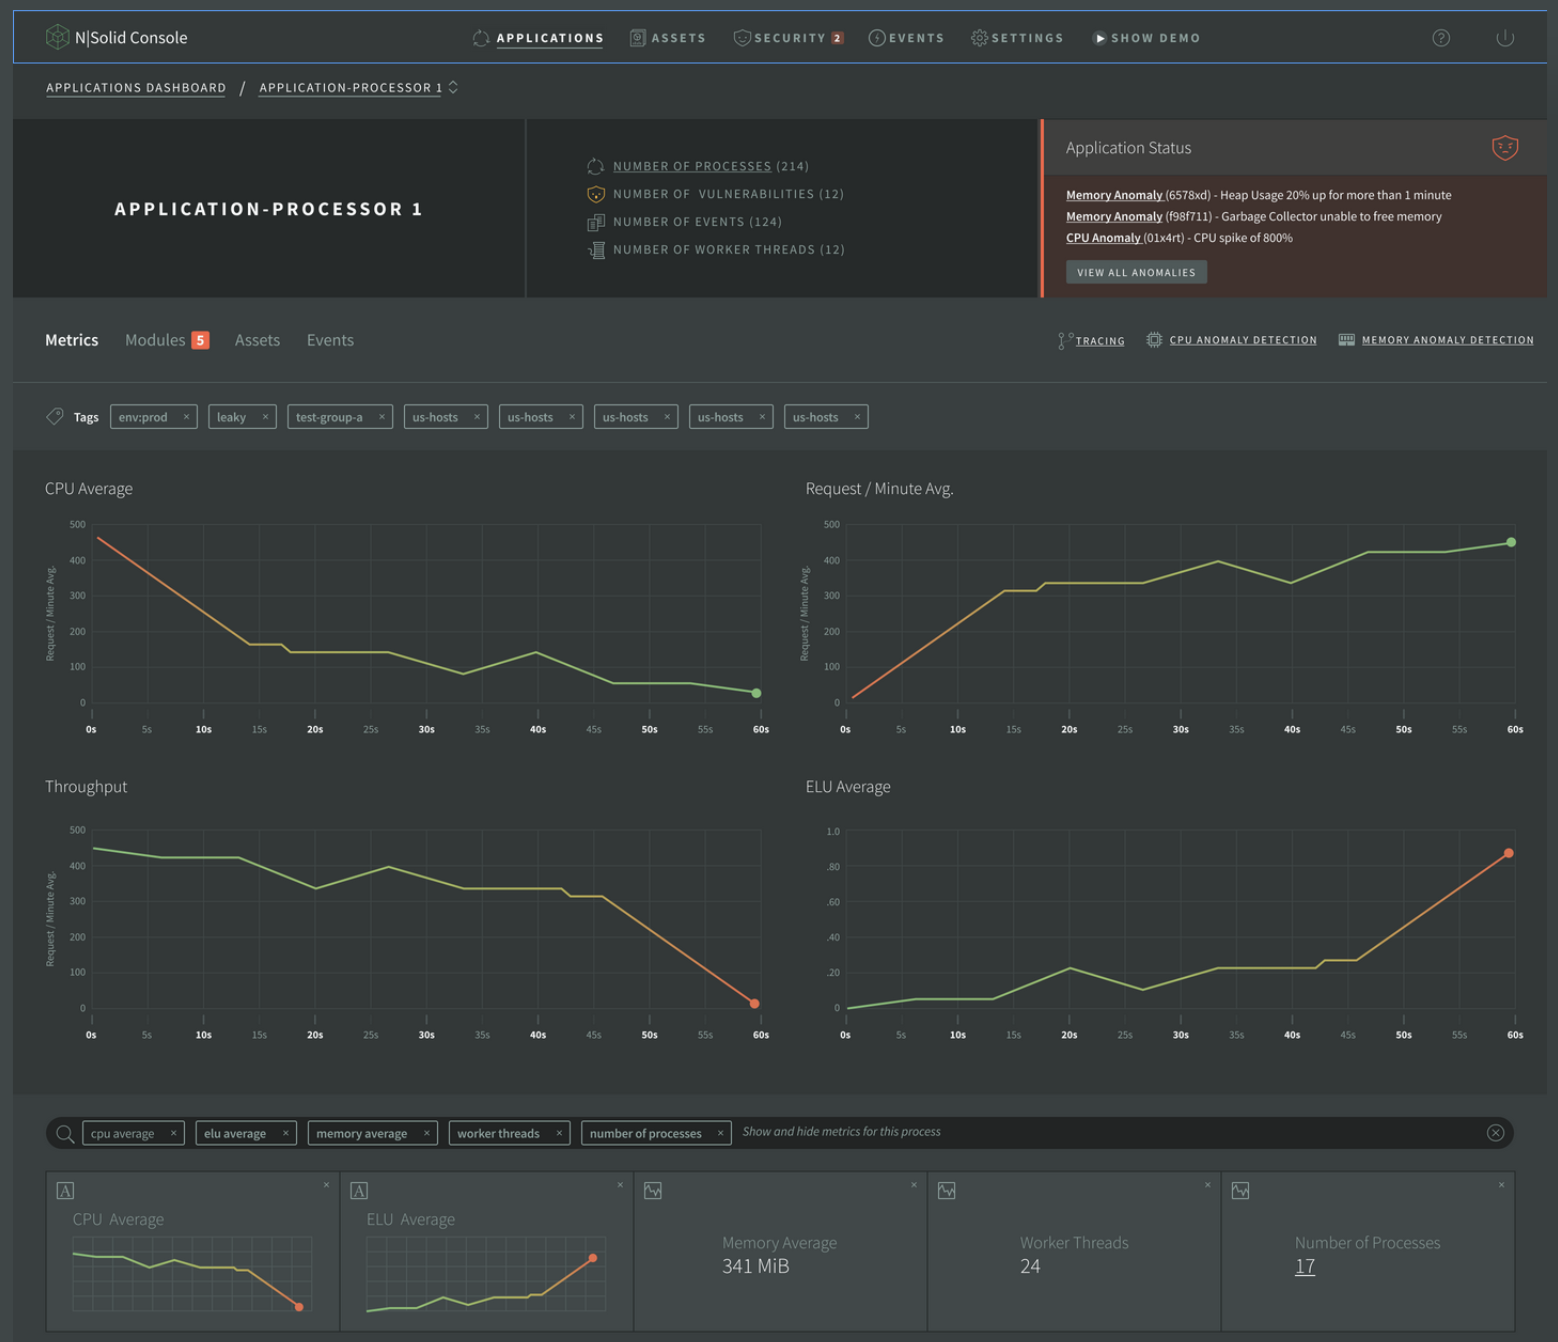
N|Solid APM - Process Monitoring
Read more here: https://nsrc.io/ProcessMonitoringNS
[3] CPU Profiling in N|Solid
Shows what functions consume CPU% and how resources are allocated.
CPU Profiling allows you to understand where opportunities exist to improve your Node processes' speed and load capacity. This feature shows what functions consume CPU% and how resources are allocated.
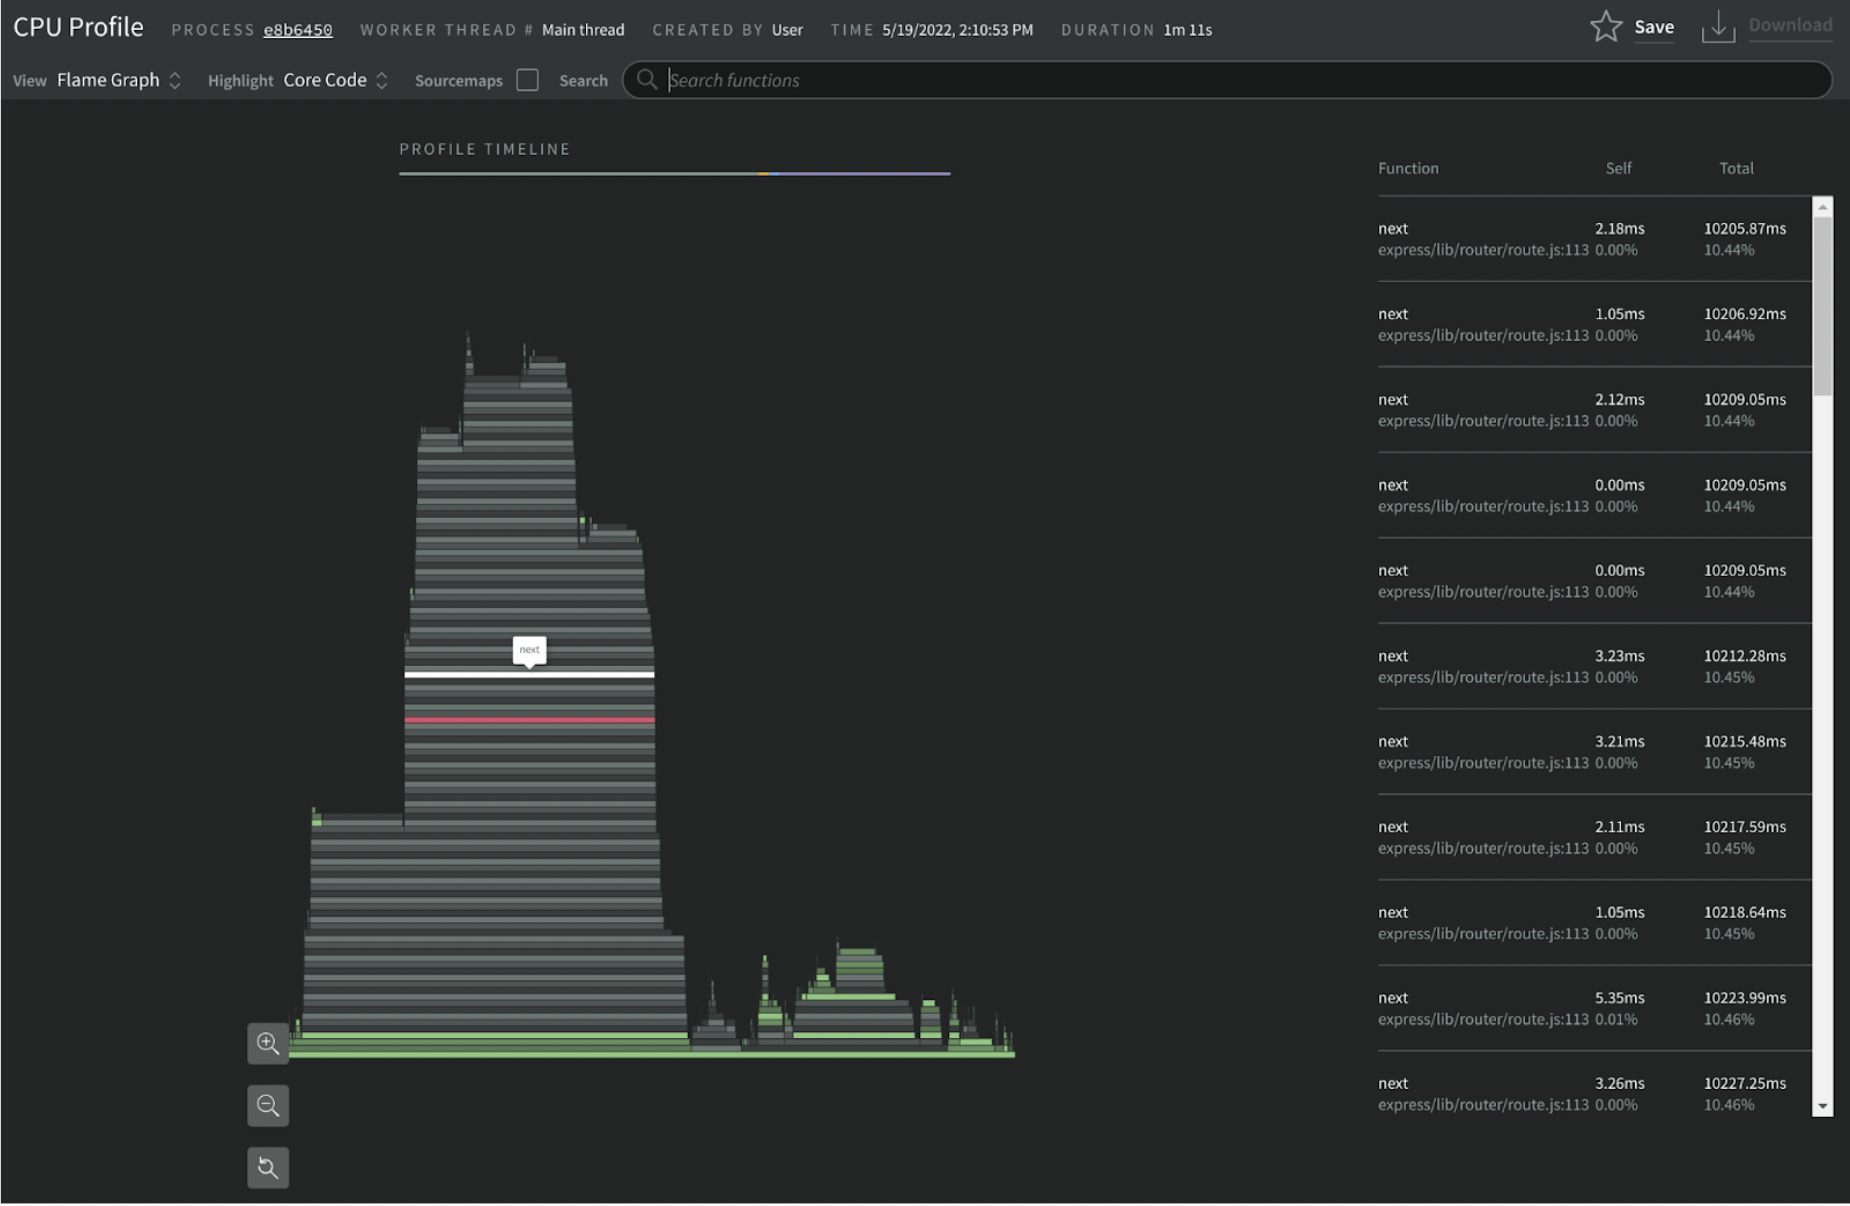
N|Solid APM - Flamegraph-CPU Profile
Read more here: https://nsrc.io/CPUProfilingNS
[4] Worker Threads in N|Solid
View In-depth metrics of each worker thread.
Worker threads are treated first class and have the same access to CPU profiles, snapshots, etc. as the main process. We are the only solution that has full support worker threads.
View In-depth metrics of each worker thread. With this feature, identify opportunities to improve the performance of CPU-intensive work.
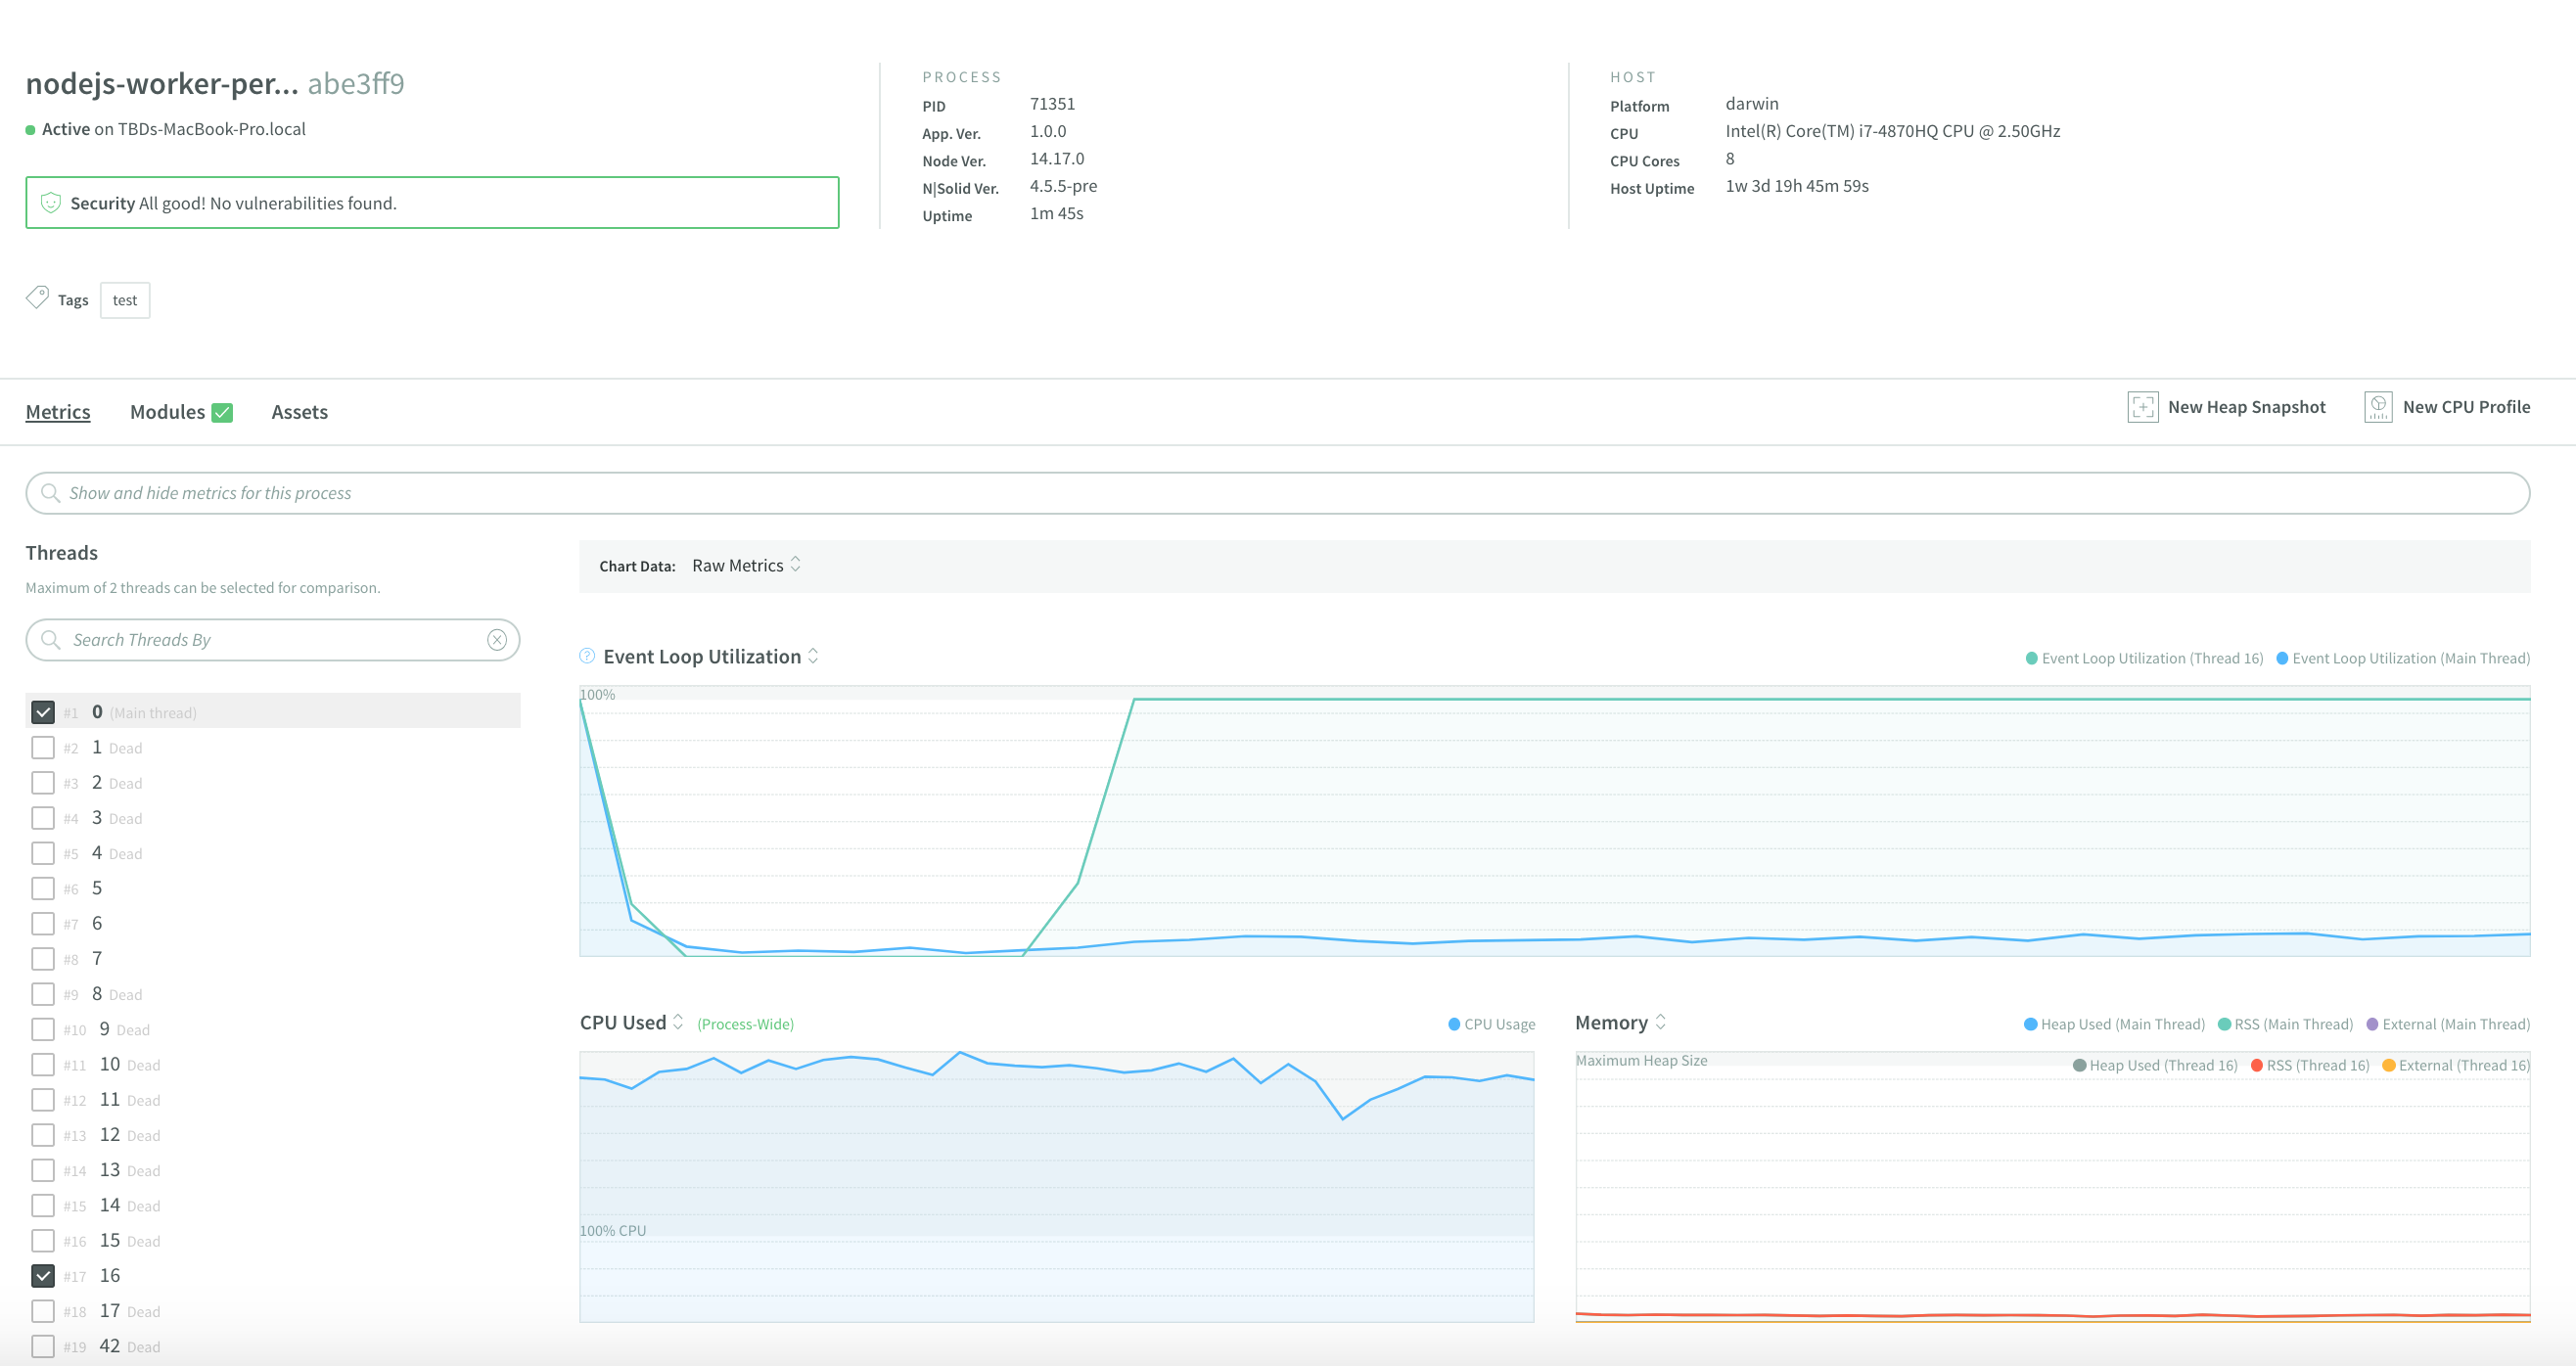
Read more here: https://nsrc.io/WorkerThreadsNS
[5] Capture Heap Snapshots in N|Solid
Understand where and how memory is being used
Taking heap snapshots is a great way to help identify the underlying problem when faced with a memory leak or performance issue. In this way, you will be able to understand where and how memory is being used, and you will be able to quickly resolve memory leaks and performance issues.
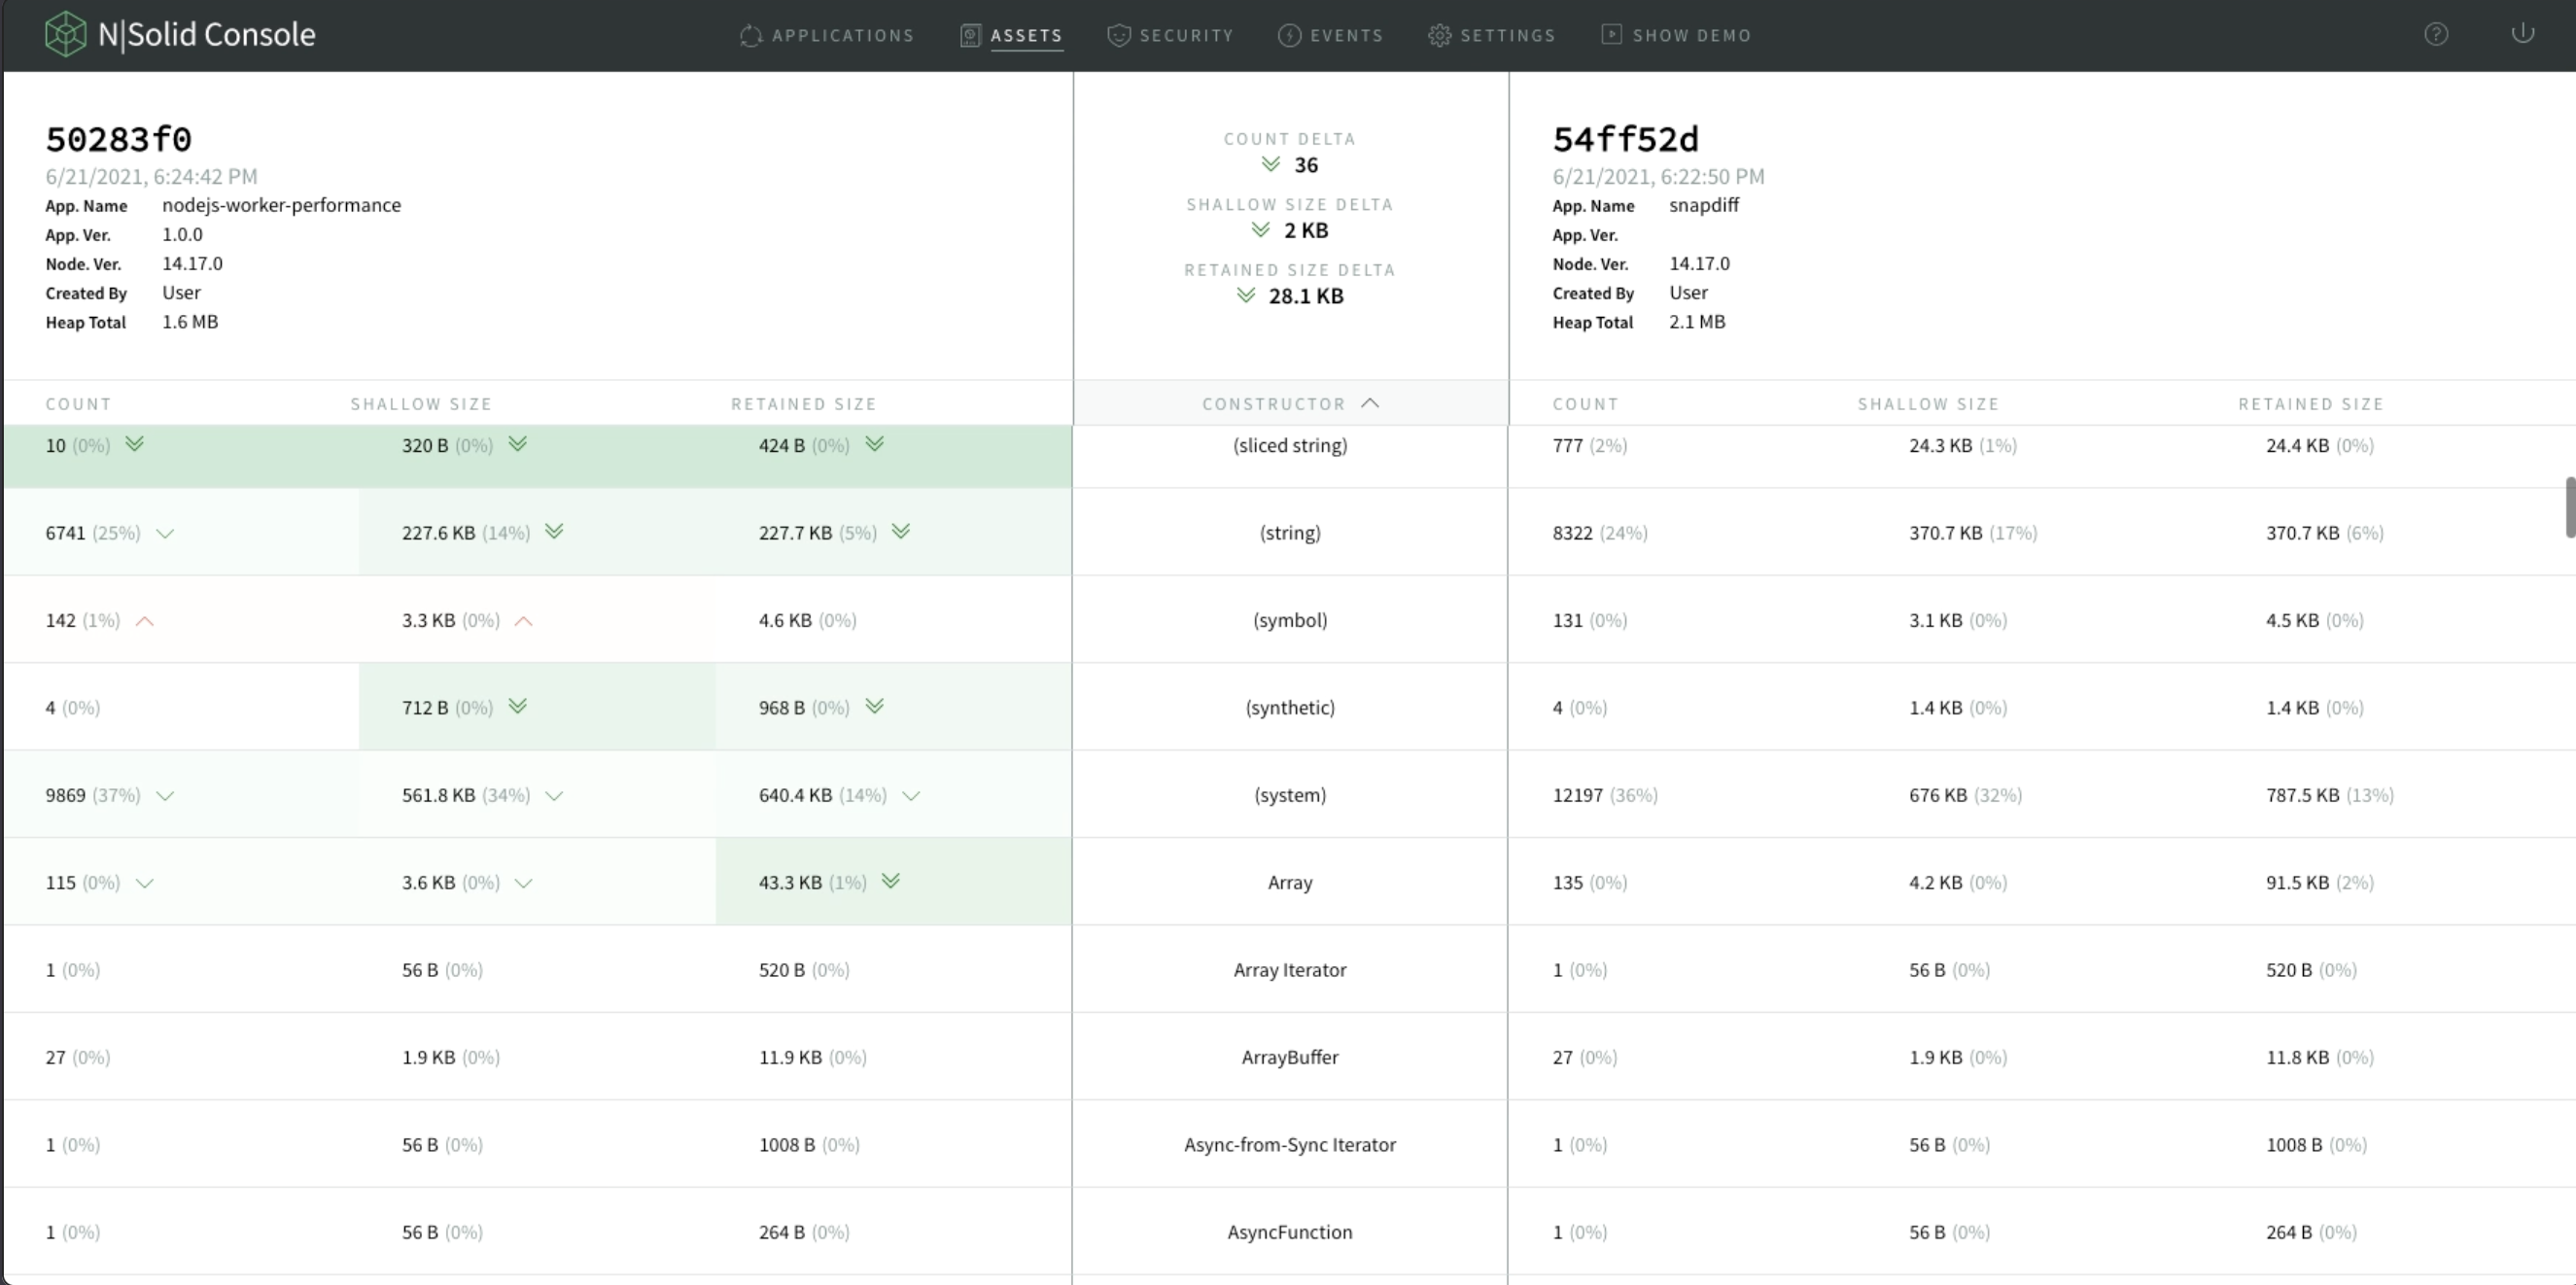
N|Solid APM - Capture Heap Snapshots
Read more here: https://nsrc.io/HeapSnapshotsNS
[6] Memory Anomaly Detection in N|Solid
View In-depth metrics of each worker thread.
Identify Memory anomalies taken with a more accurate detection method.
- Insights and metrics are historical, before and after the incident happened.
- Get anomalies at different heap usage levels.
- Detect correlation between sets of memory-specific metrics.
- Filter results by specific processes inside your application.
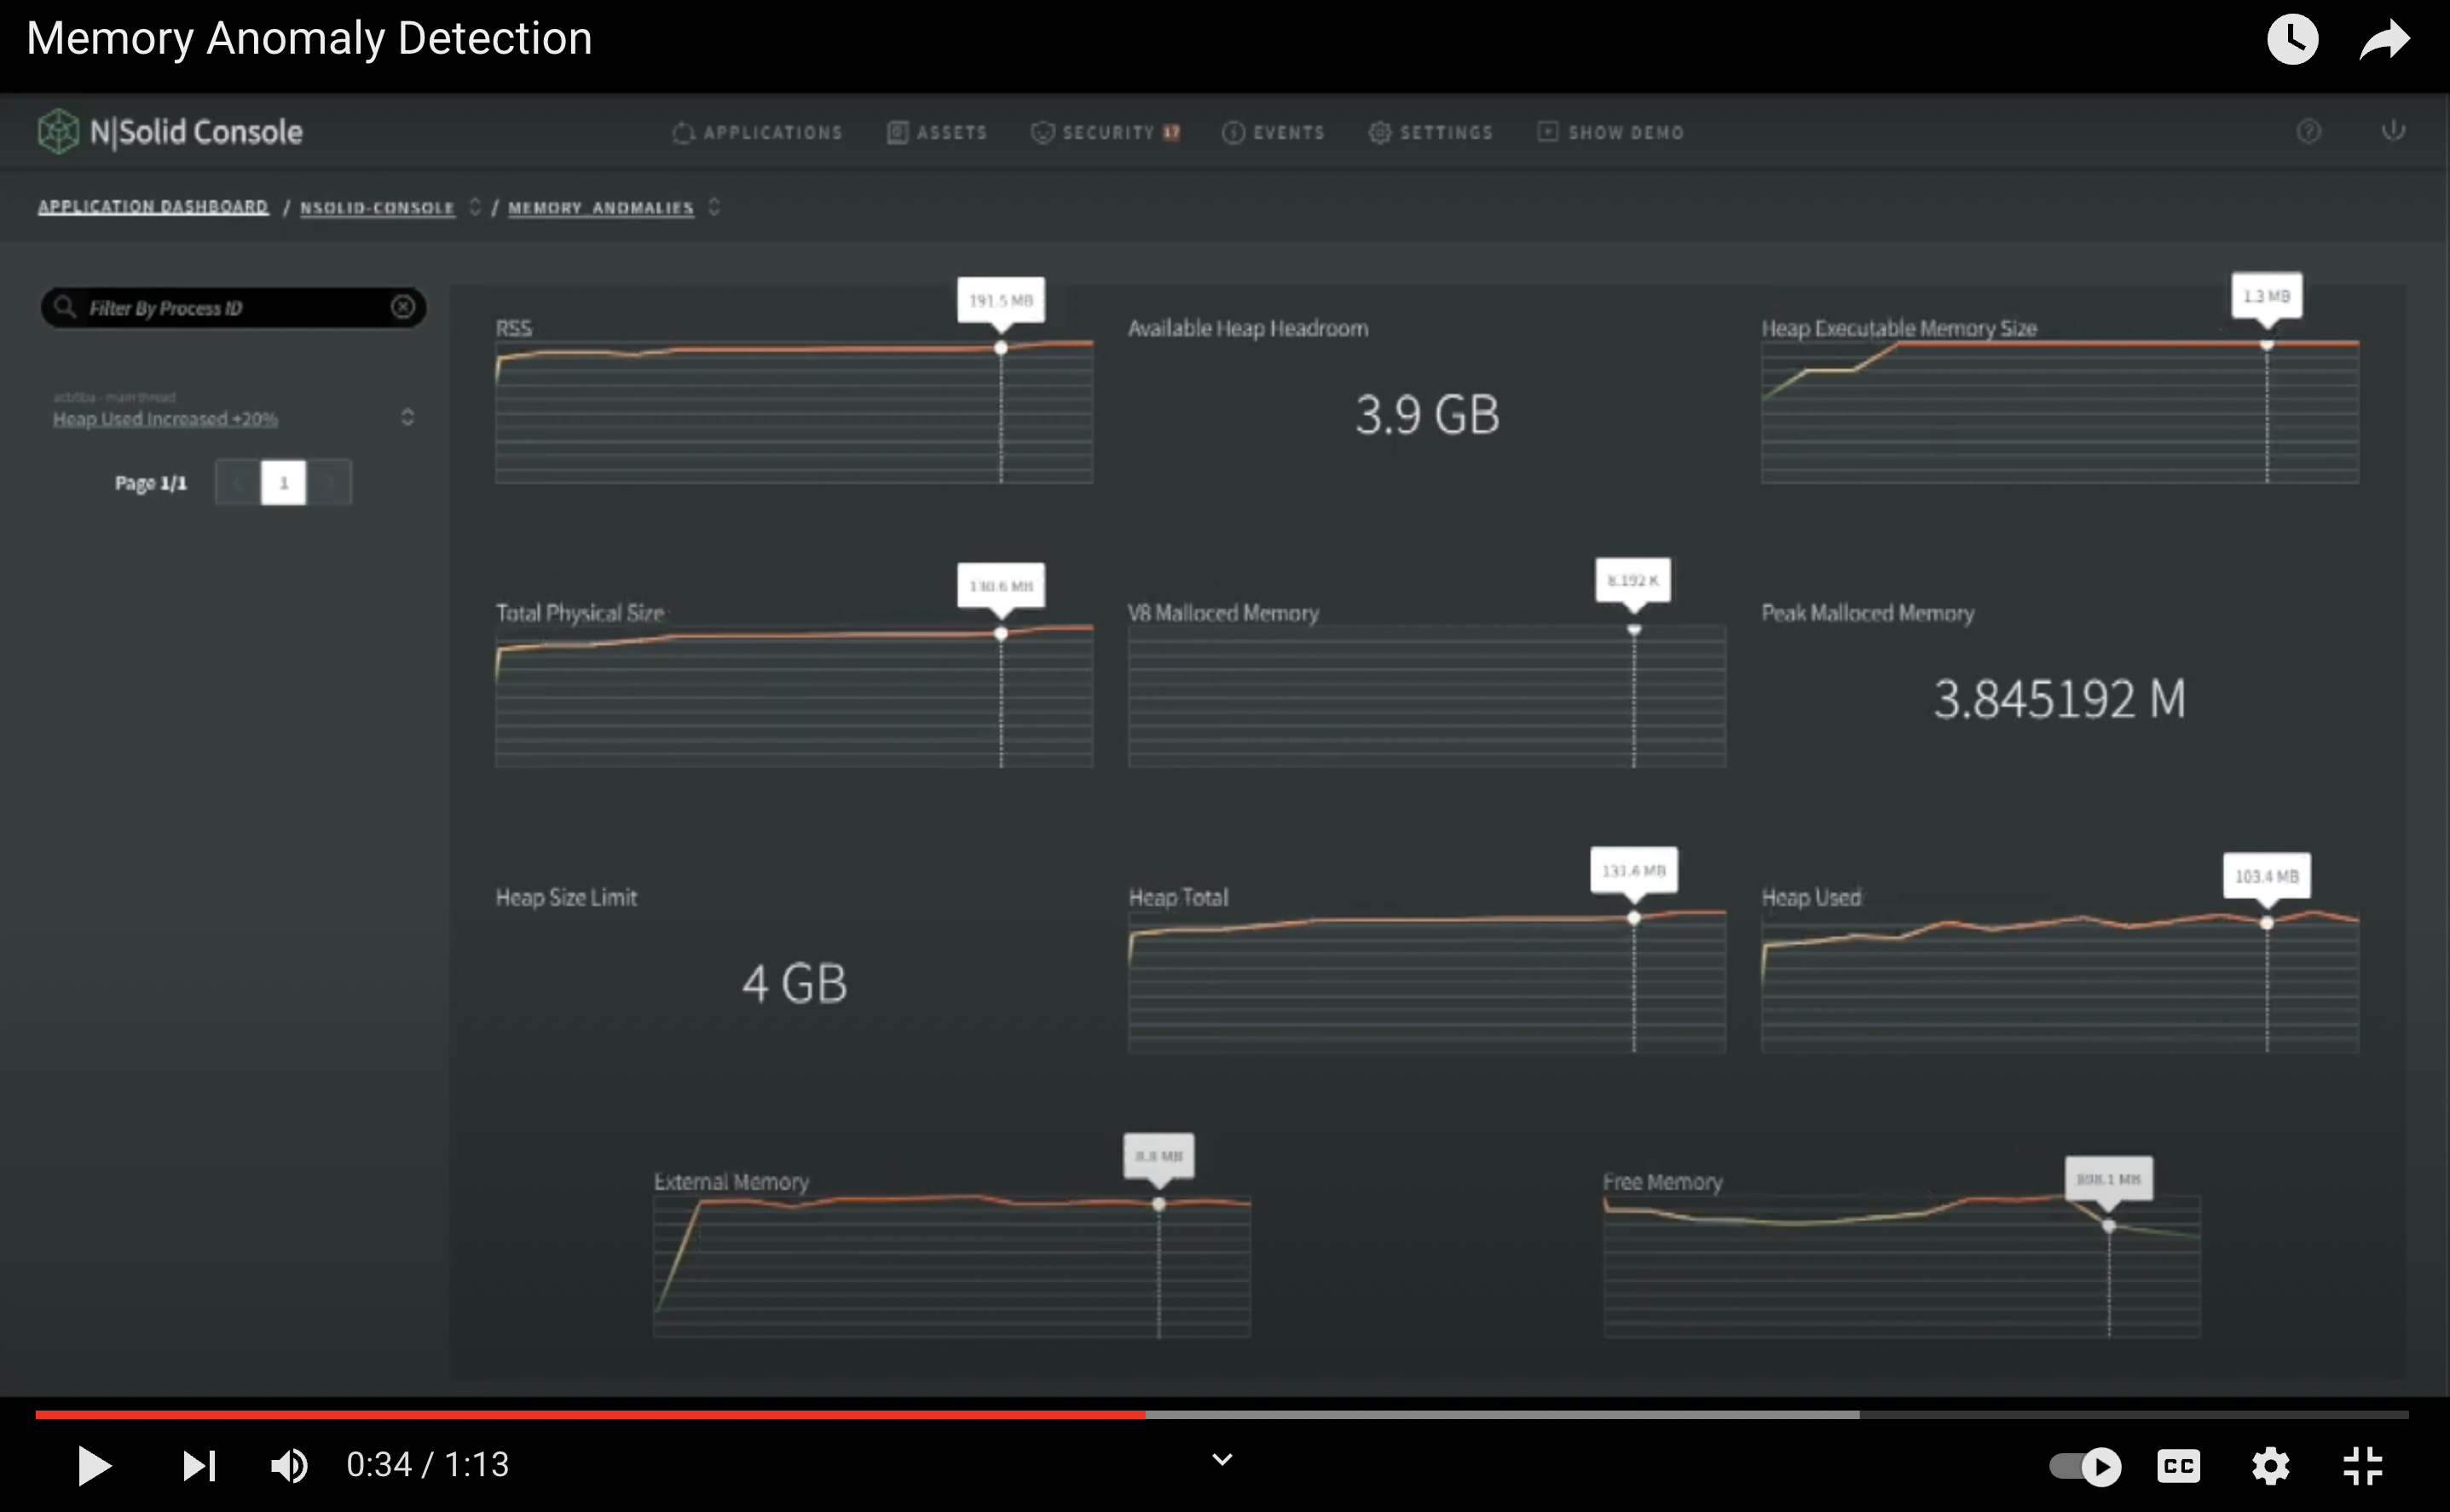
N|Solid APM - Memory Anomaly Detection
Read more here: https://nsrc.io/MemoryAnomalyNS
[7] Vulnerability Scanning - NCM - in N|Solid
Know all of the potential vulnerabilities within your application.
NCM is security, compliance, and curation tool around the 3rd-Party Node.js & JavaScript package ecosystem. It provides protection against security vulnerabilities and licensing compliance issues and provides risk assessment when working with a 3rd-party ecosystem.
The N|Solid Console can be configured to perform periodic verification of all packages loaded by all N|Solid processes.
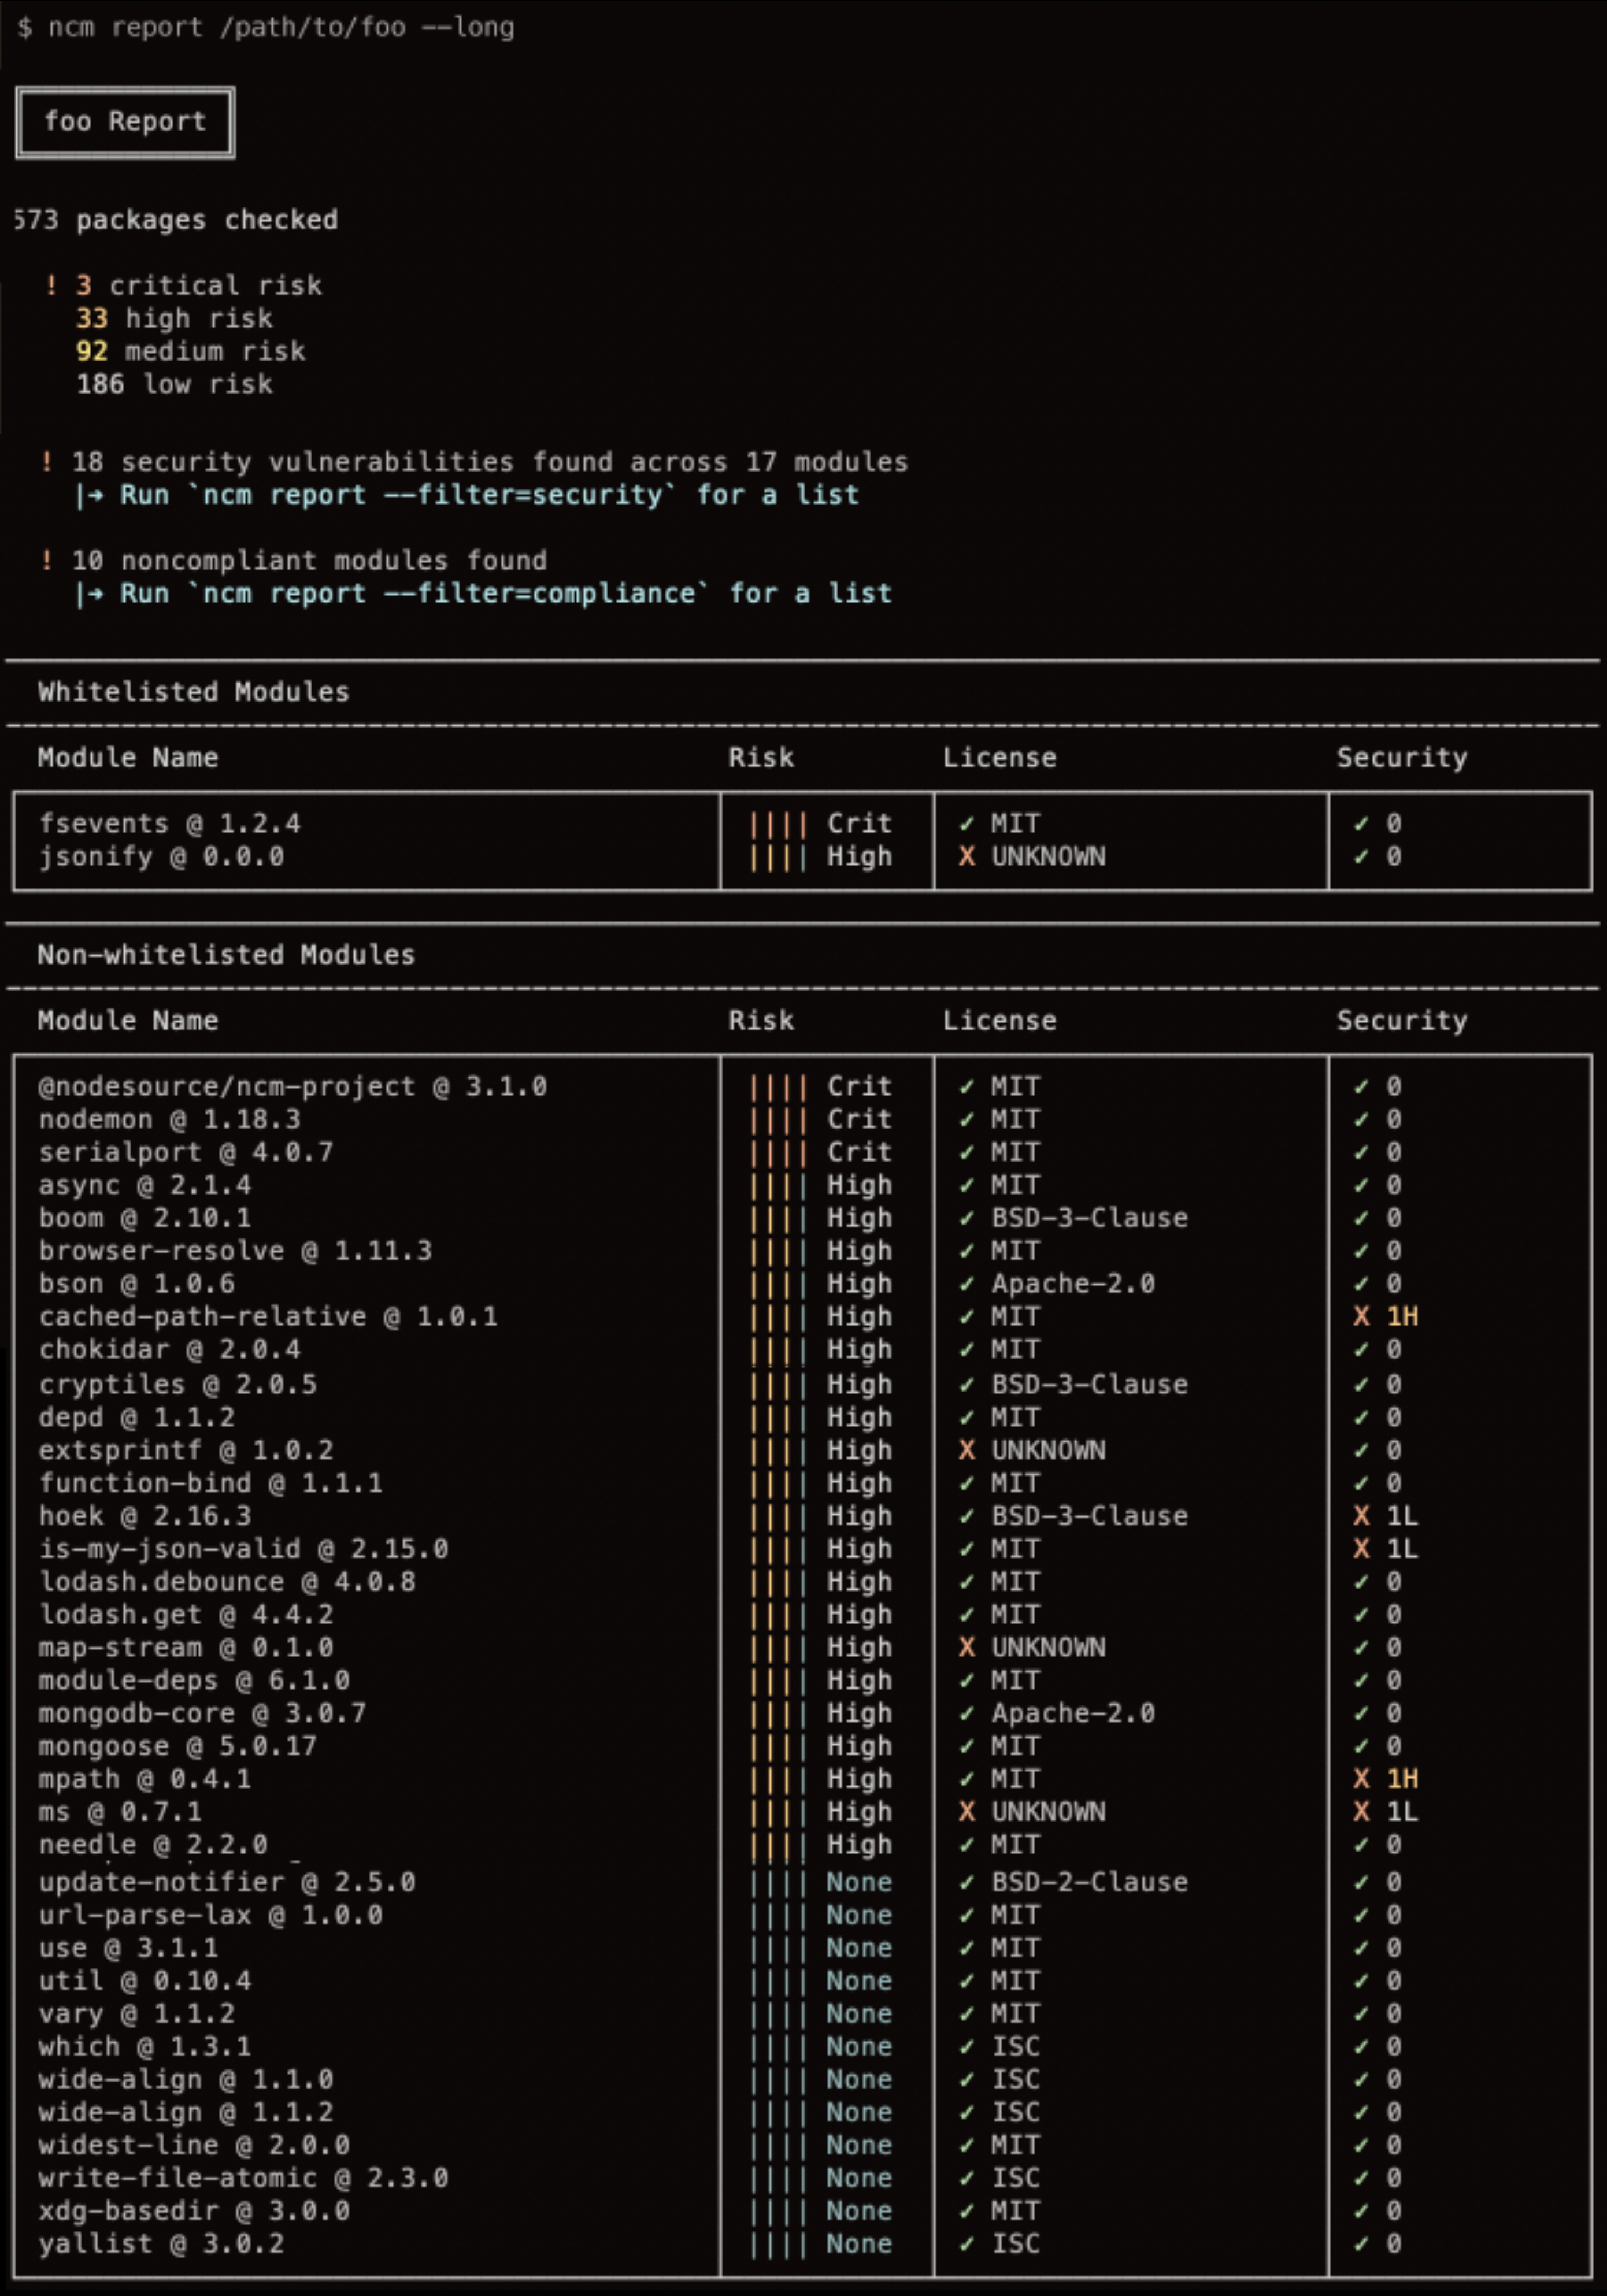
N|Solid APM - Vulnerability Scanning from N|Solid Runtime
NCM provides
- Actionable insights.
- Offline vulnerability scanning.
- Prevent processes in an application from launching if they have vulnerabilities with "strict mode."
- NCM-CI (Service Tokens and CI Processes) customization.
Note: NCM can be viewed from 3 locations: full overview, per application, and per process.
Read more here: https://nsrc.io/VulnerabilityScanningNS
[8] HTTP Tracing support in N|Solid
Enables the ability to debug application latency and other issues.
HTTP tracing gathers throughput and the lifecycle of any HTTP, DNS, or other types of request.
- Debug latency issues, monitor your services, and more with the collected information.
- See in a timeline graph the density of the number of tracked spans.
- Inspect each span for more detail on the collected trace.
- Filter the results by the attributes of a span and delimit them to the time range.
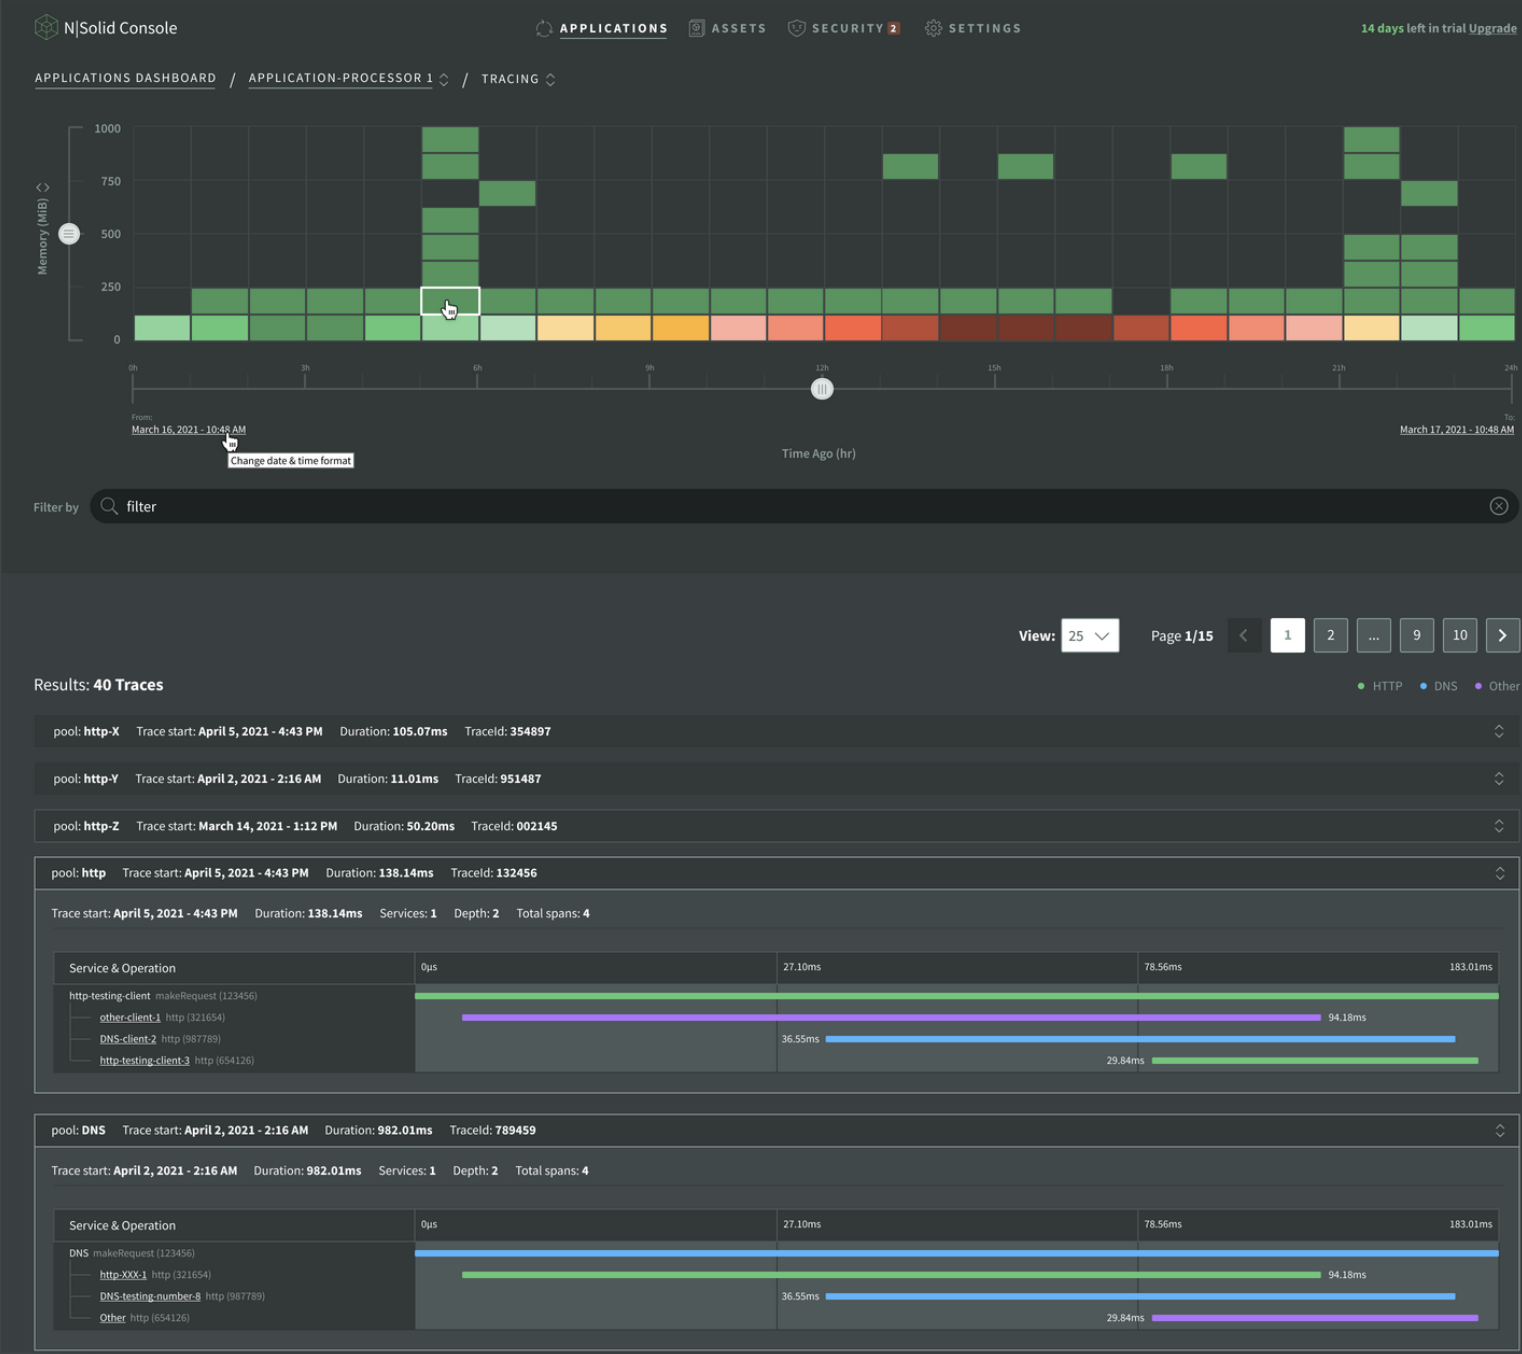
N|Solid APM - HTTP Tracing Support
Read more here: https://nsrc.io/HTTPTracingNS
[9] Global Alerts & Integrations in N|Solid
Be aware of issues and vulnerabilities. Pre-configured API integrations with key 3rd party services.
You can use automation to trigger alerts over integrations, CPU profiles, or heap snapshots. Be aware of issues and vulnerabilities, Pre-configured API integrations with key 3rd party services.
So when creating the heap snapshot, for example, I will have the notification directly in Slack of my N|Solid Console's behavior; from there, I can check it by opening the Console.
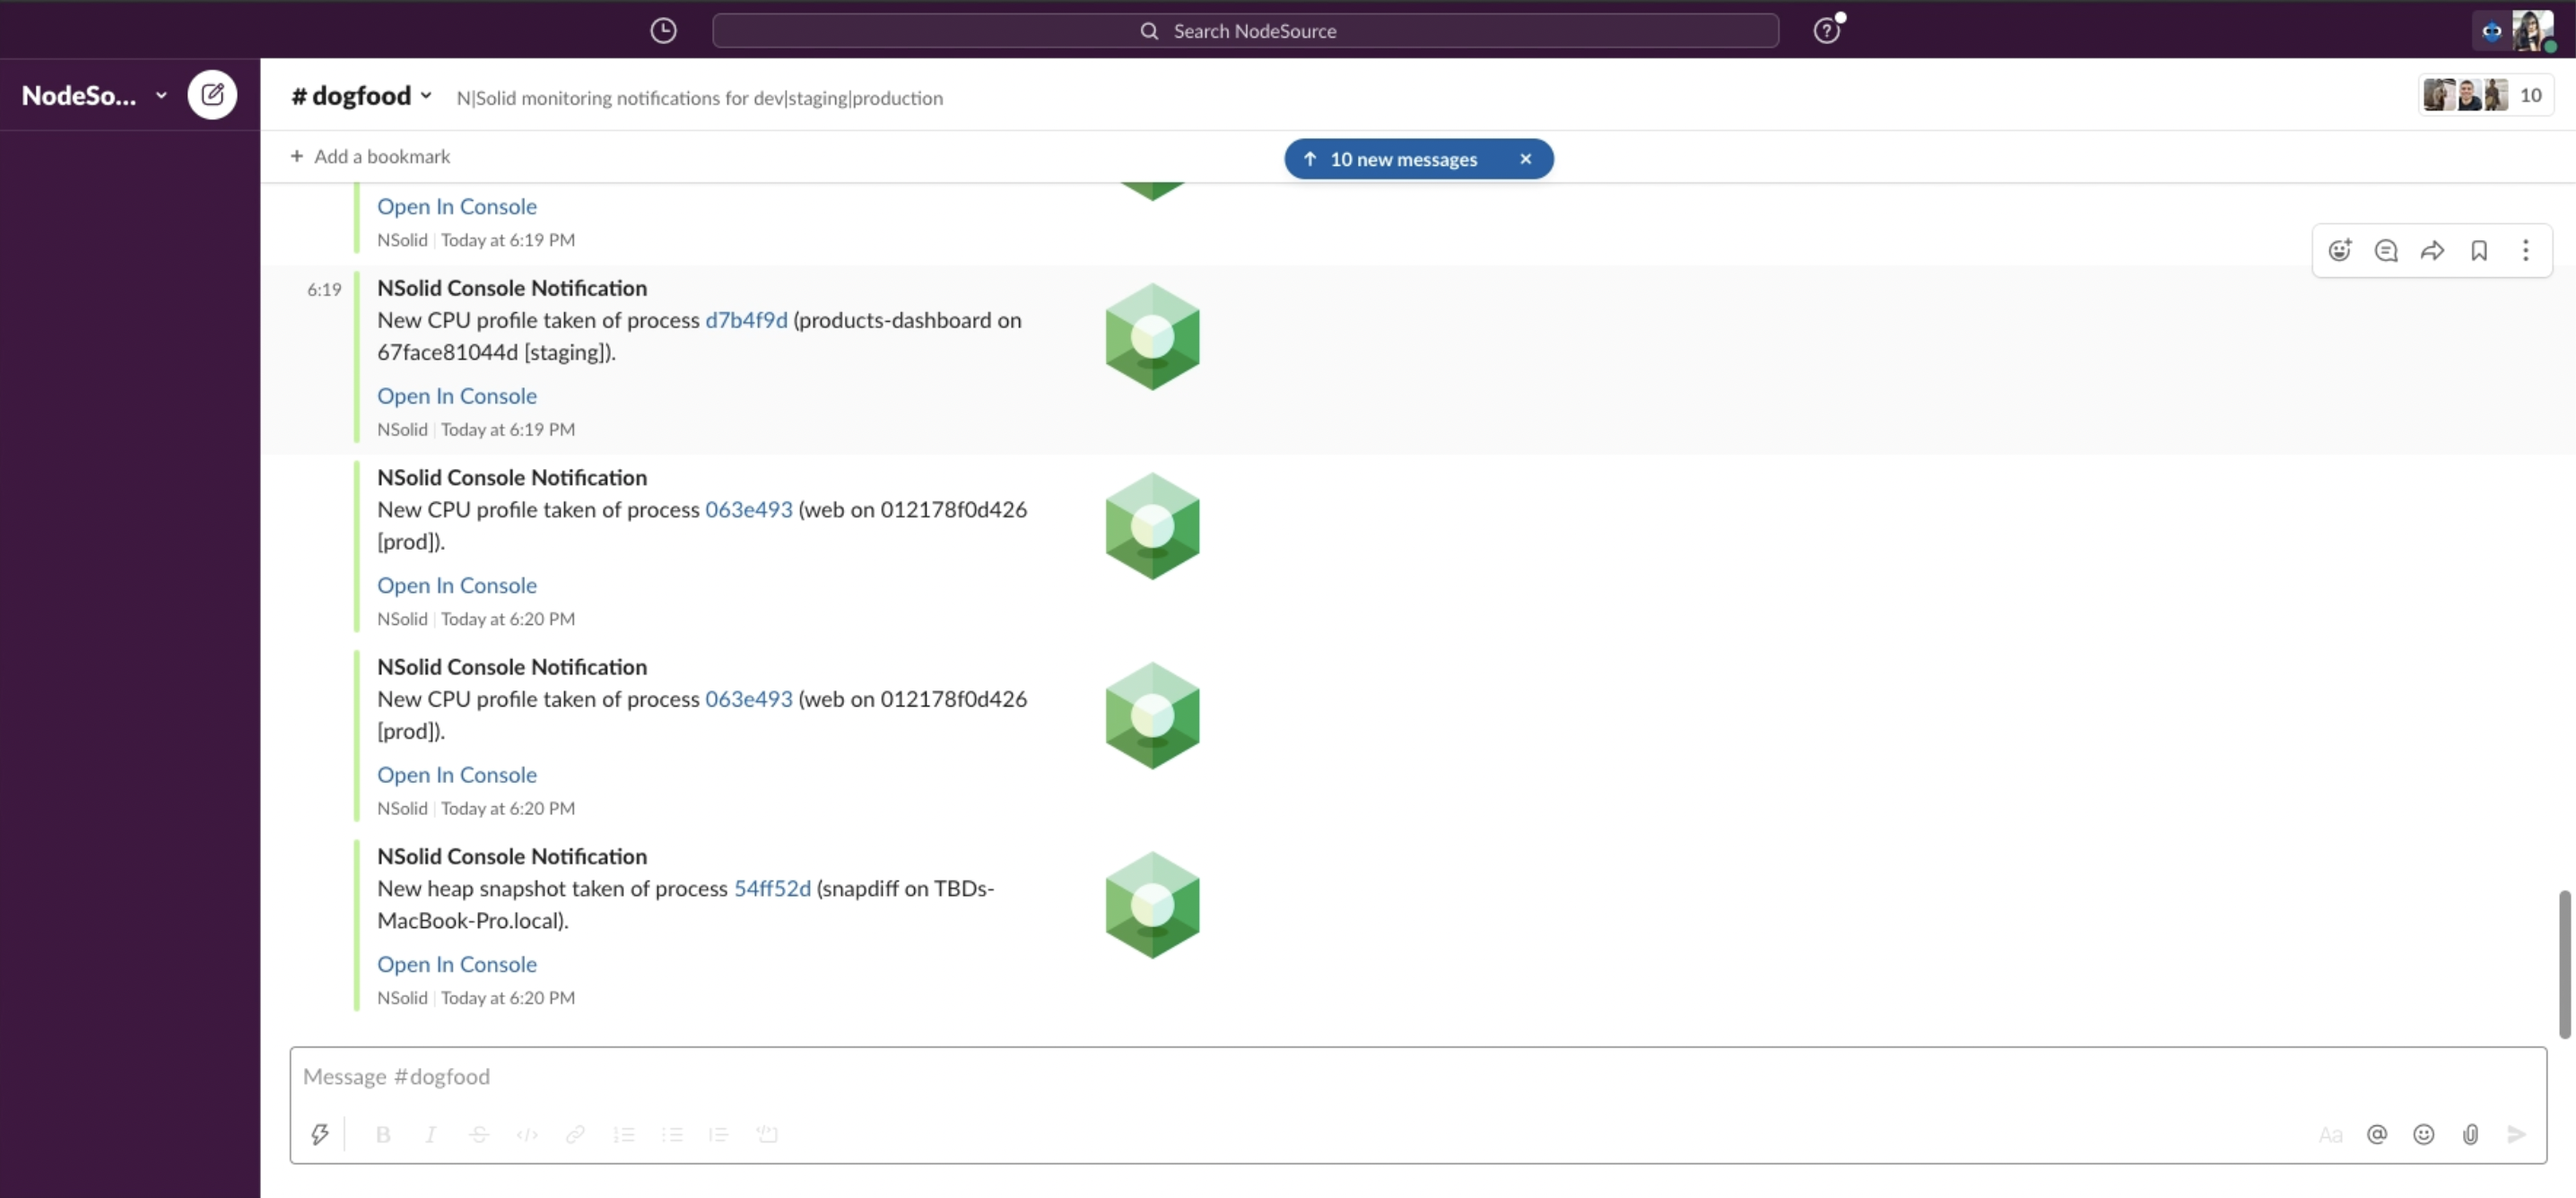
N|Solid APM - Global Alerts & Integrations - Slack Example
Read more here: https://nsrc.io/GlobalAlertsIntegrationsNS
[10] Distributed Tracing in N|Solid
Better understand the factors that affect an application's latency.
Distributed tracing is a core component of Observability mainly used by site reliability engineers (SREs) but also by developers and is recommended in that way to obtain the greatest benefits as a team in charge of modern distributed software.
As your system scales, you'll need to add a tracing and refine sampling capabilities, which means getting the context to understand the complexity of distributed architectures.
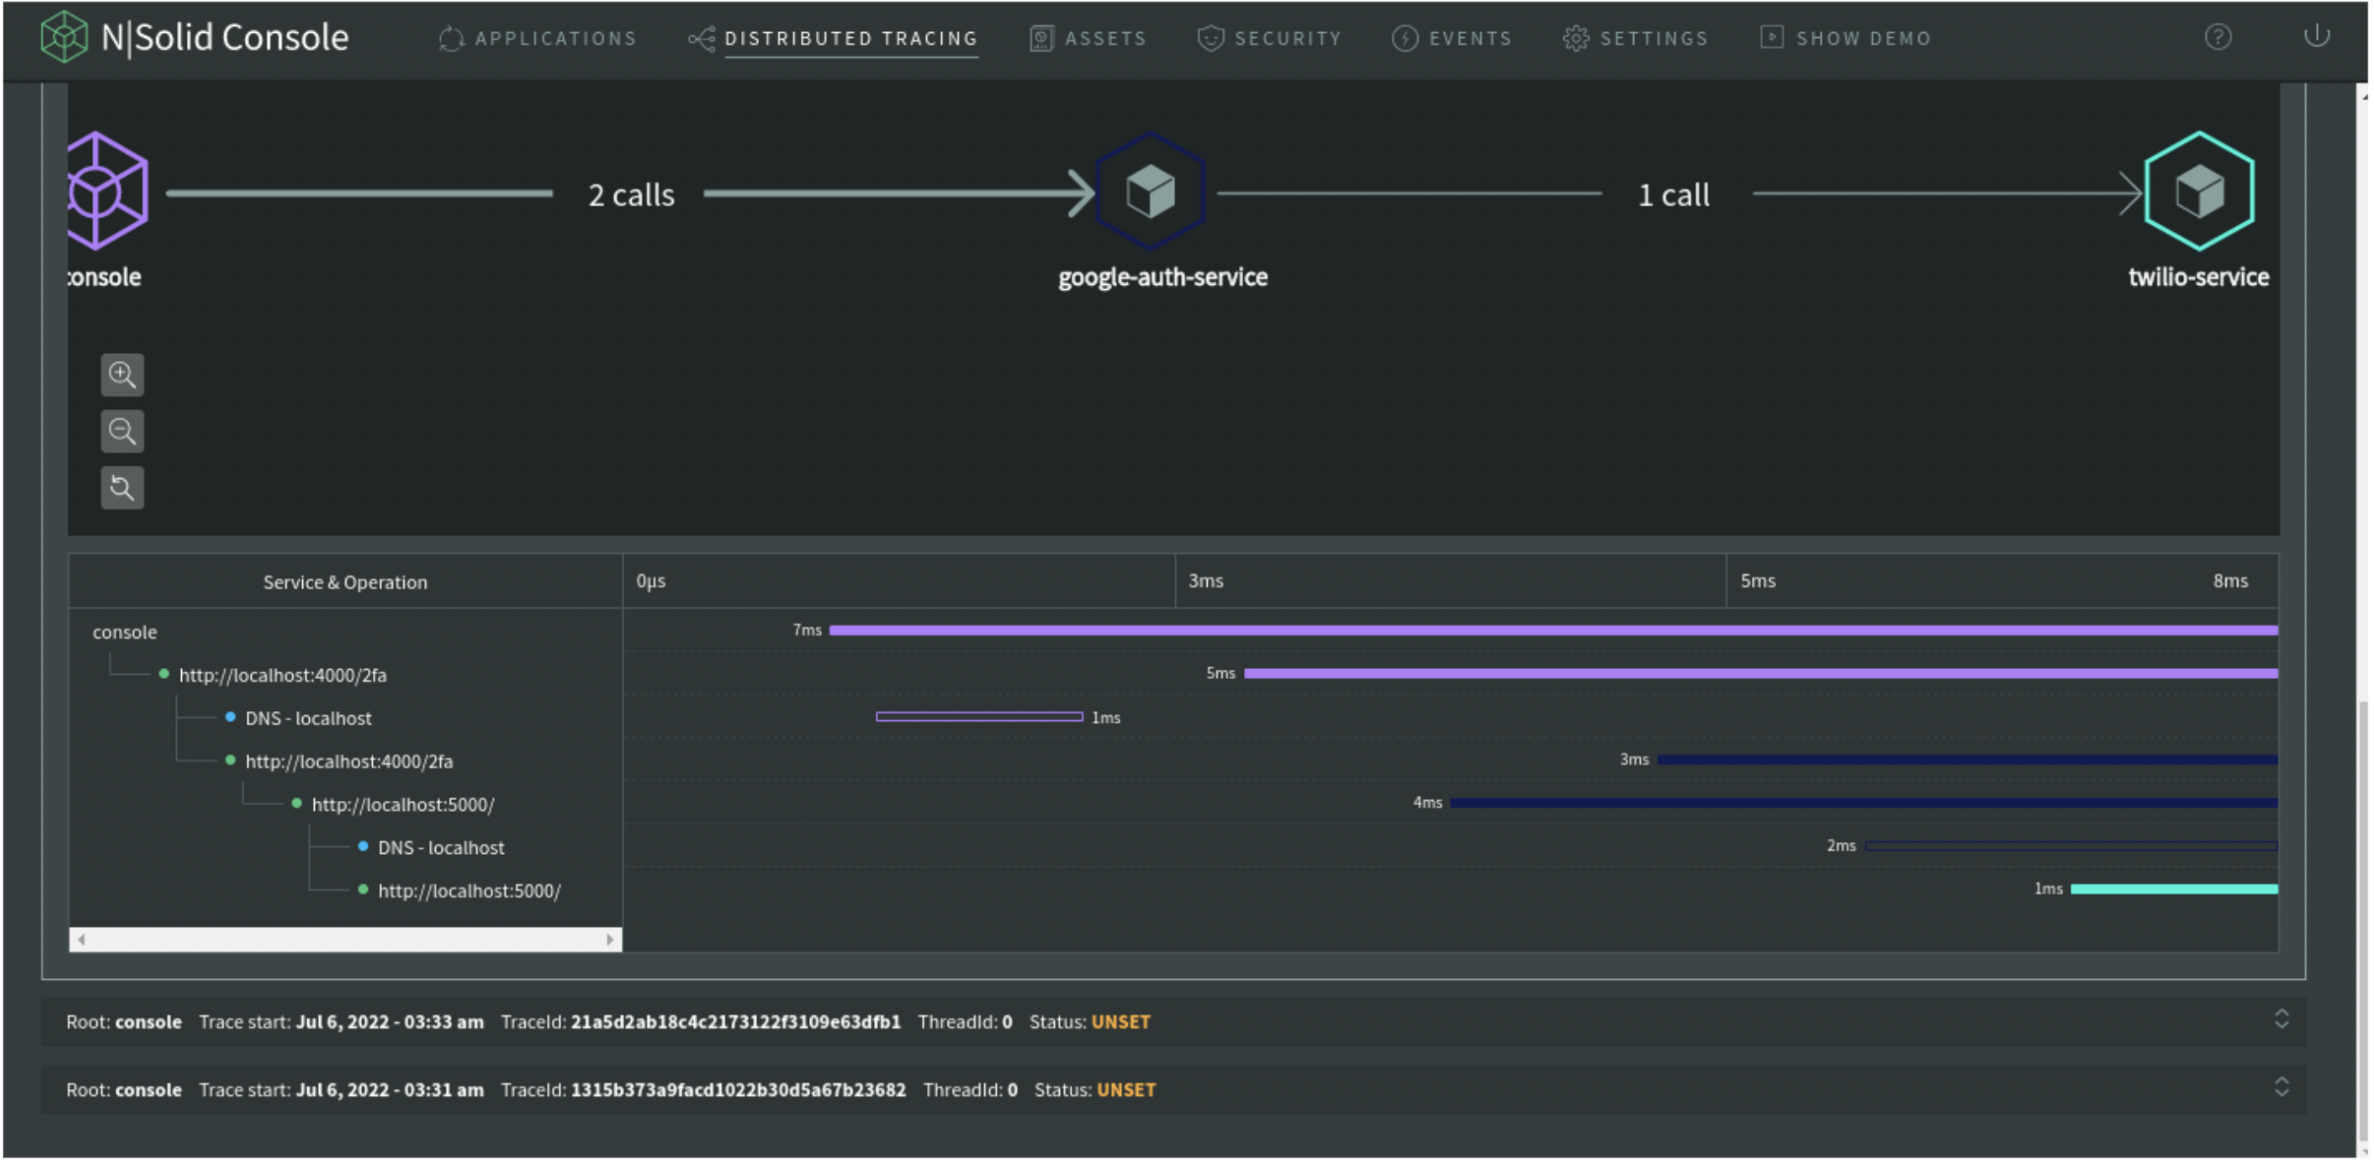
N|Solid APM - Distributed Tracing
Distributed Tracing provides several solutions, which include:
- Monitoring system health
- Latency trend and outliers
- Control flow graph
- Asynchronous process visualization
- Debugging microservices
Read more here: https://nsrc.io/DistributedTracingNS
Still, on our roadmap, we are planning and executing features that will shake up the ecosystem in the coming months. Stay tuned! 😎
Top Ten Features In N|Solid
- 🧭Projects & Applications Monitoring in N|Solid - https://nsrc.io/ProjectApplicationsMonitoringNS
- 🌌 Process Monitoring in N|Solid - https://nsrc.io/ProcessMonitoringNS
- 🔍 CPU Profiling in N|Solid - https://nsrc.io/CPUProfilingNS
- 🕵️♂️ Worker Threads Monitoring in N|Solid - https://nsrc.io/WorkerThreadsNS
- 📸 Capture Heap Snapshots in N|Solid - https://nsrc.io/HeapSnapshotsNS
- 🚨 Memory Anomaly Detection in N|Solid - https://nsrc.io/MemoryAnomalyNS
- 🚩 Vulnerability Scanning & 3rd party Modules Certification in N|Solid - https://nsrc.io/VulnerabilityScanningNS
- 👣 HTTP Tracing Support in N|Solid - https://nsrc.io/HTTPTracingNS
- ⏰ Global Alerts & Integrations in N|Solid - https://nsrc.io/GlobalAlertsIntegrationsNS
- 🪄 Distributed Tracing in N|Solid - https://nsrc.io/DistributedTracingNS ...and more
Want to try N|Solid?
To check out the top 10 features and more in N|Solid, create your account in sign up or sign in, in the top right corner of our main page. More information is available here.
As always, we're happy to hear your thoughts – feel free to get in touch with our team or reach out to us on Twitter at @nodesource.