Instrument your Nodejs Applications with Open Source Tools - Part 2


As we mentioned in the previous article, at NodeSource, we are dedicated to observability in our day-to-day, and we know that a great way to extend our reach and interoperability is to include the Opentelemetry framework as a standard in our development flows; because in the end our vision is to achieve high-performance software, and it is what we want to accompany the journey of developers in their Node.js base applications.
With this, we know that understanding the bases was very important to know the standard and its scope, but that it is necessary to put it into practice. How to integrate Opentelemetry in our application?; and although NodeSource has direct integration into its product in addition to more than 10 key functionalities in N|Solid, that extend the offer of a traditional APM, as you know, we are great contributors to the Open Source project, we also support the binary distributions of the Node.js project, our DNA is always helping the community and showing you how through Open Source tools you can still increase the visibility. So through this article, we want to share how to set up OpenTelemetry with Open Source tools.
In this article, you will find How to Apply the OpenTelemetry OS framework in your Node.js Application, which includes:
- Step 1: Export data to the backend
- Step 2: Set up the Open Telemetry SDK
- Step 3: Inspect Prometheus to review we're receiving data
- Step 4: Inspect Jaeger to review we're receiving data
- Step 5: Getting deeper at Jaeger 👀
Note: This article is an extension of our talk at NodeConf.EU, where we had the opportunity to share the talk:
Dot, line, Plane Trace! Instrument your Node.js applications with Open Source Software Get insights into the current state of your running applications/services through OpenTelemetry. It has never been as easy as now to collect data with Open Source SDKs and tools that will help you extract metrics, generate logs and traces and export this data in a standardized format to be analyzed using the best practices. In this talk, We'll show how easy it is to integrate OpenTelemetry in your Node.js applications and how to get the most out of it using Open Source tools.
To see the talks from this incredible conference, you can watch all sessions through live-stream links below 👇
- Day 1️⃣ - https://youtu.be/1WvHT7FgrAo
- Day 2️⃣ - https://youtu.be/R2RMGQhWyCk
- Day 3️⃣ - https://youtu.be/enklsLqkVdk
Now we are ready to start 💪 📖 👇
Apply the OpenTelemetry OS framework in your Node.js Application
So, going back to the distributed example we described in our previous article, here we can see what the architecture looks like this after adding observability.
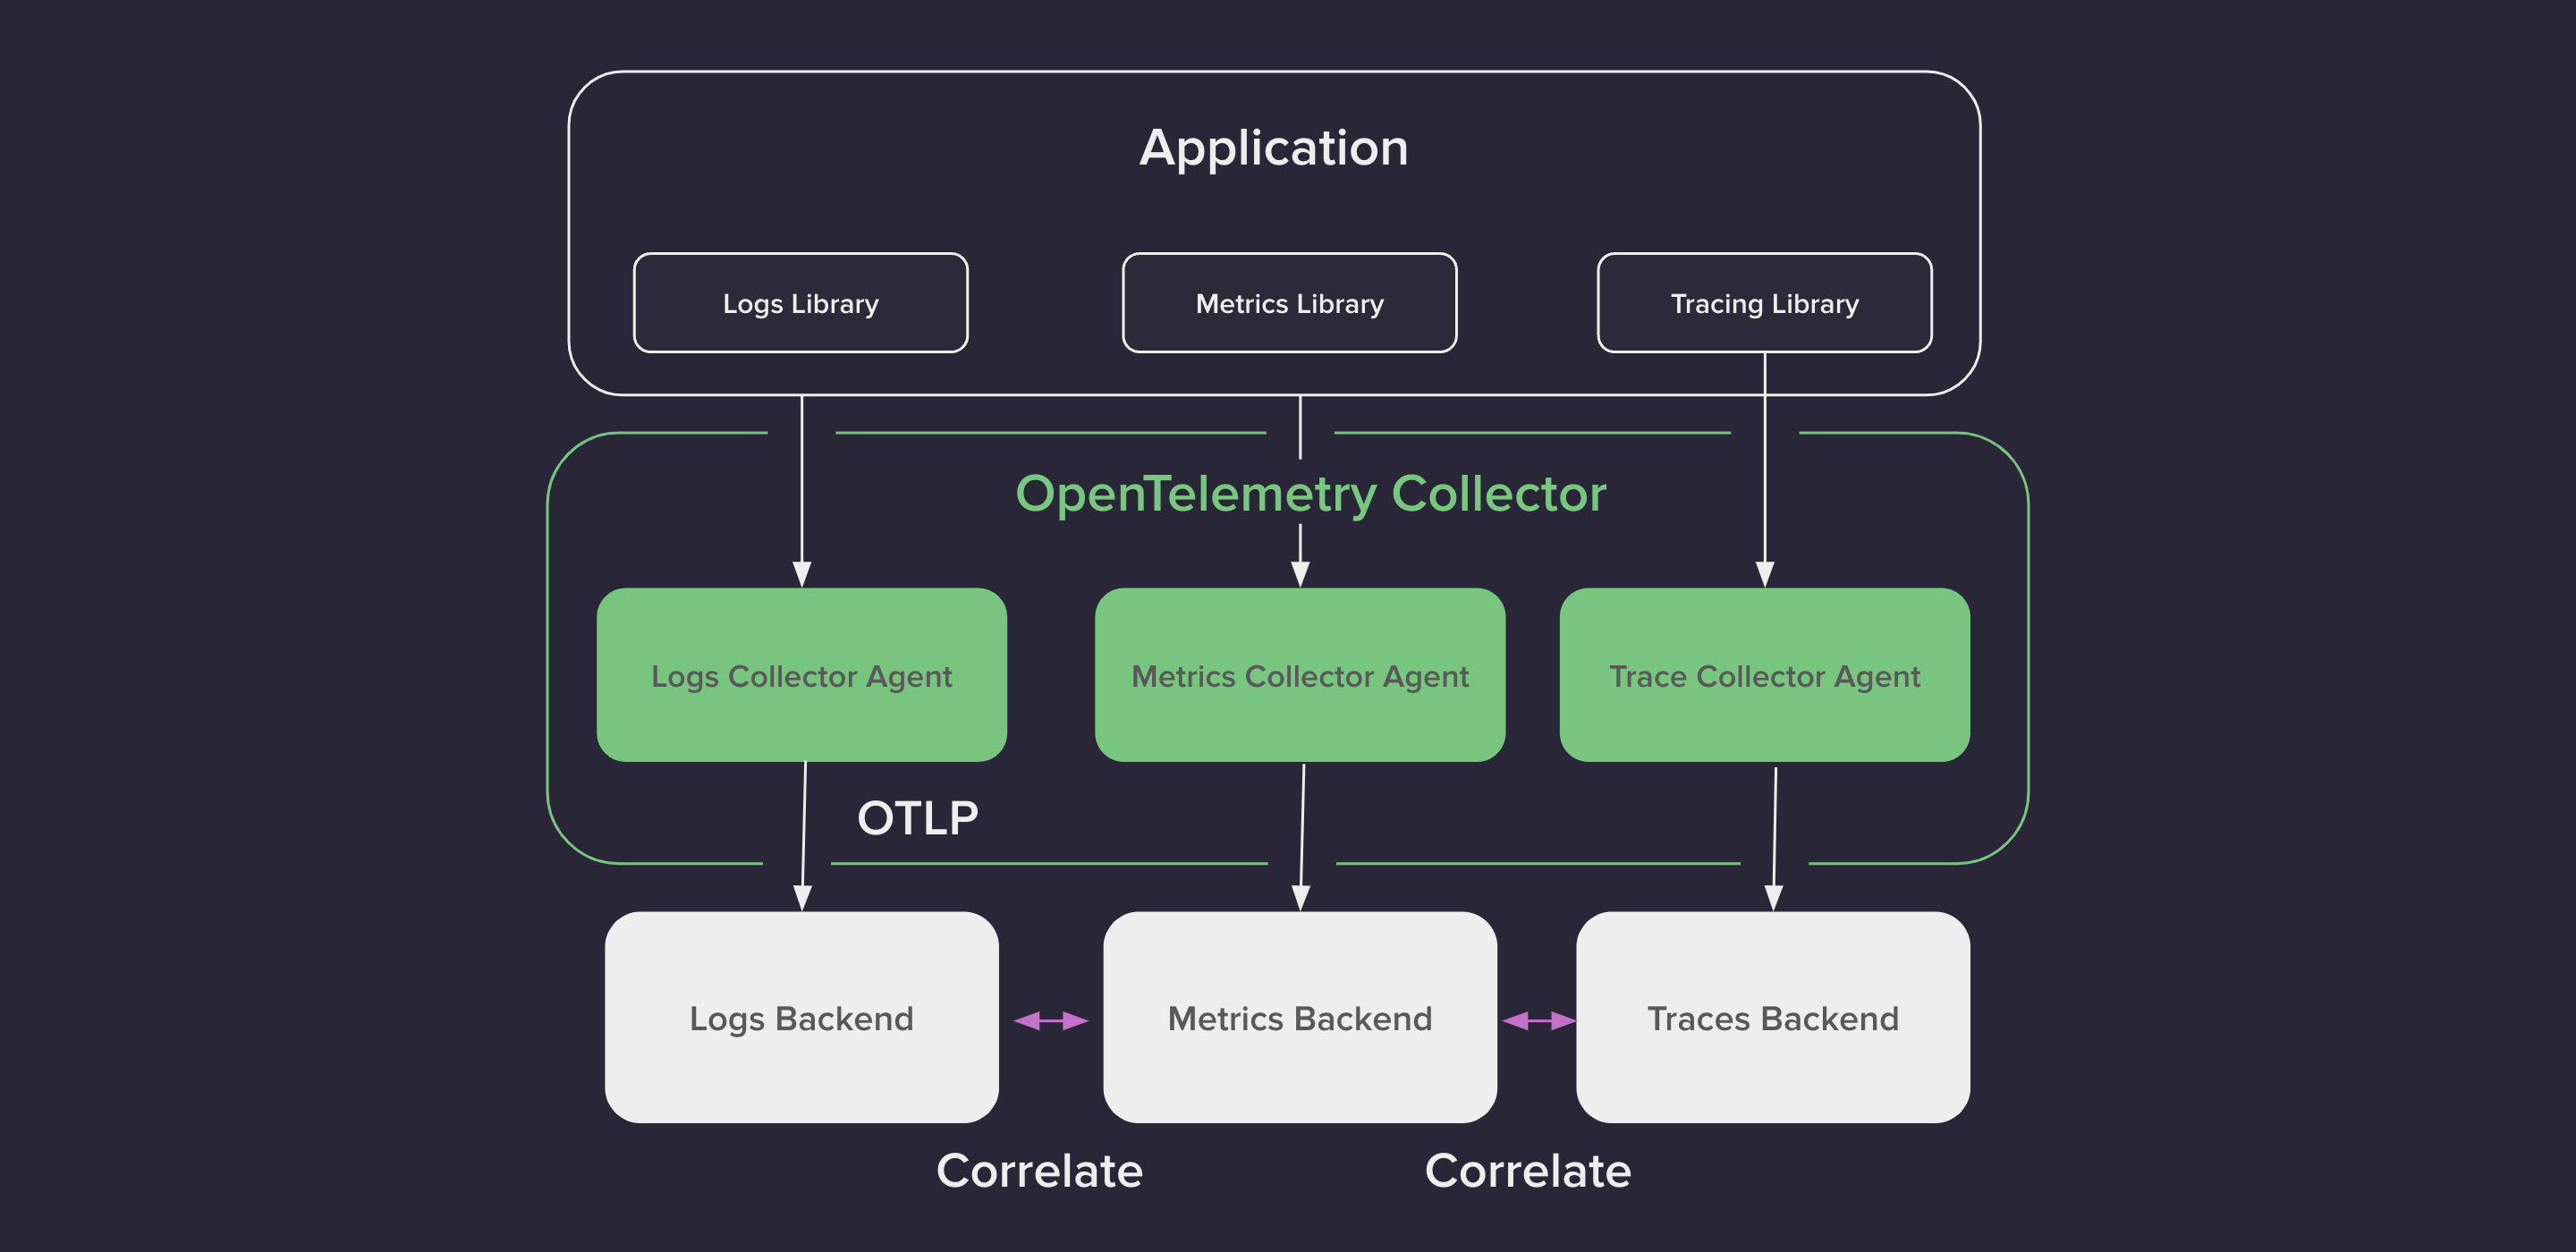
Every service will collect signals by using the OpenTelemetry Node.js SDK and export the data to specific backends so we can analyze it.
We are going to use the following:
- JAEGER for Traces and Logs.
- Prometheus to visualize the metrics.
Note: __Jaeger and Prometheus are probably the most popular open-source tools in space.
Step 1: Export data to the backend
How the data is exported to the backends differs:
To send data to __JAEGER, we will use OTLP over HTTP, whereas for Prometheus, the data will be pulled from the services using HTTP.

First, we will show you how easy it is to set up the OpenTelemetry SDK to add observability to our applications.
### Step 2: Set up the OpenTelemetry SDK
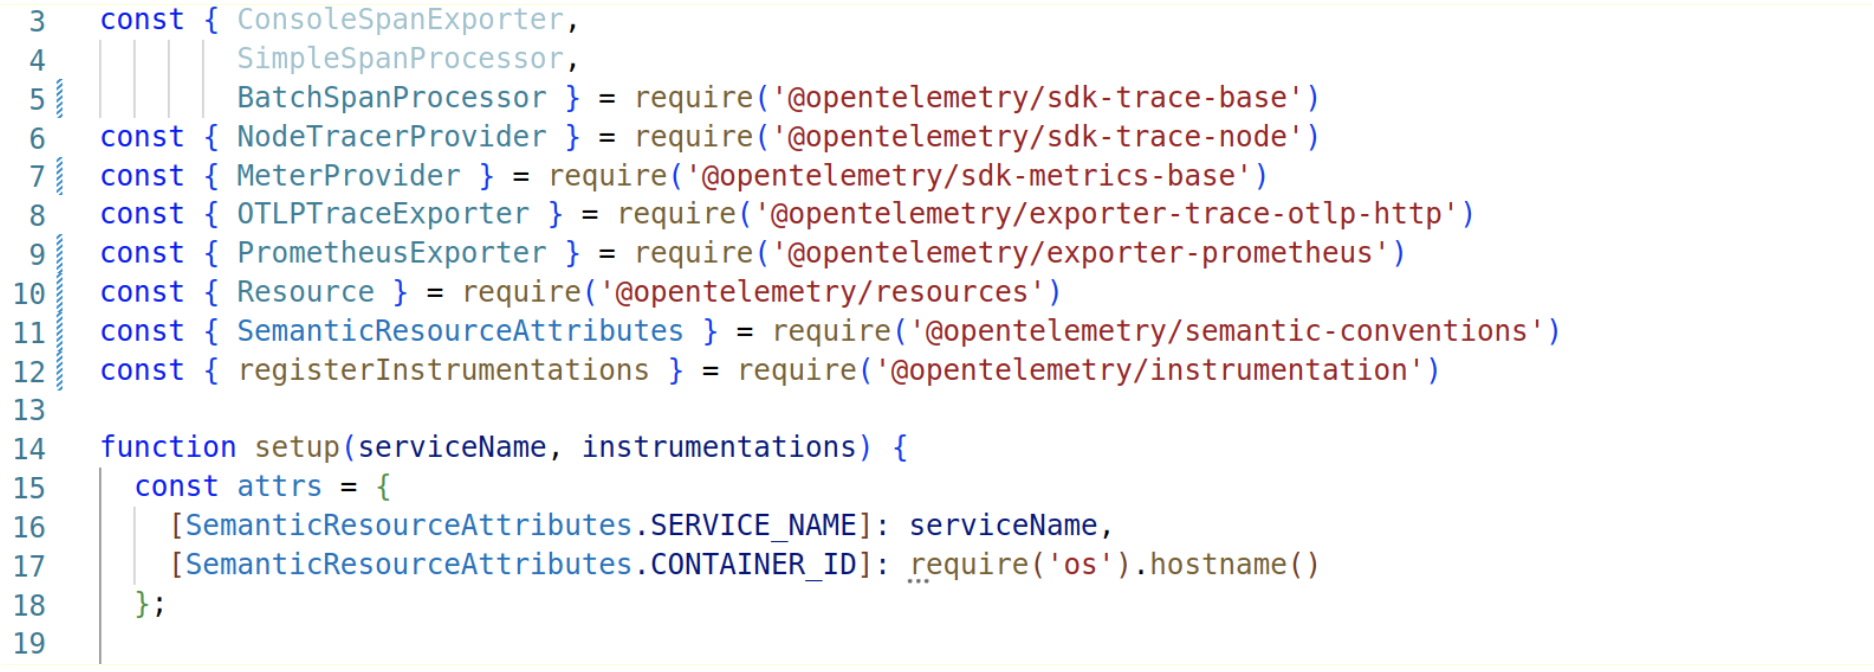
First, we have the providers in charge of collecting the signals, in our case NodeTracerProvider for traces and MeterProvider for metrics.
Then the exporters send the collected data to the specific backends.
The Resource contains attributes describing the current process, in our case, ServiceName and Container. Id’s. The name of these attributes is well defined by the spec (it’s in the semantic_conventions module) and will allow us to differentiate where a specific signal comes from.
So to set up traces and metrics, the process is basically the same: we create the provider passing the Resource, then register the specific exporter.
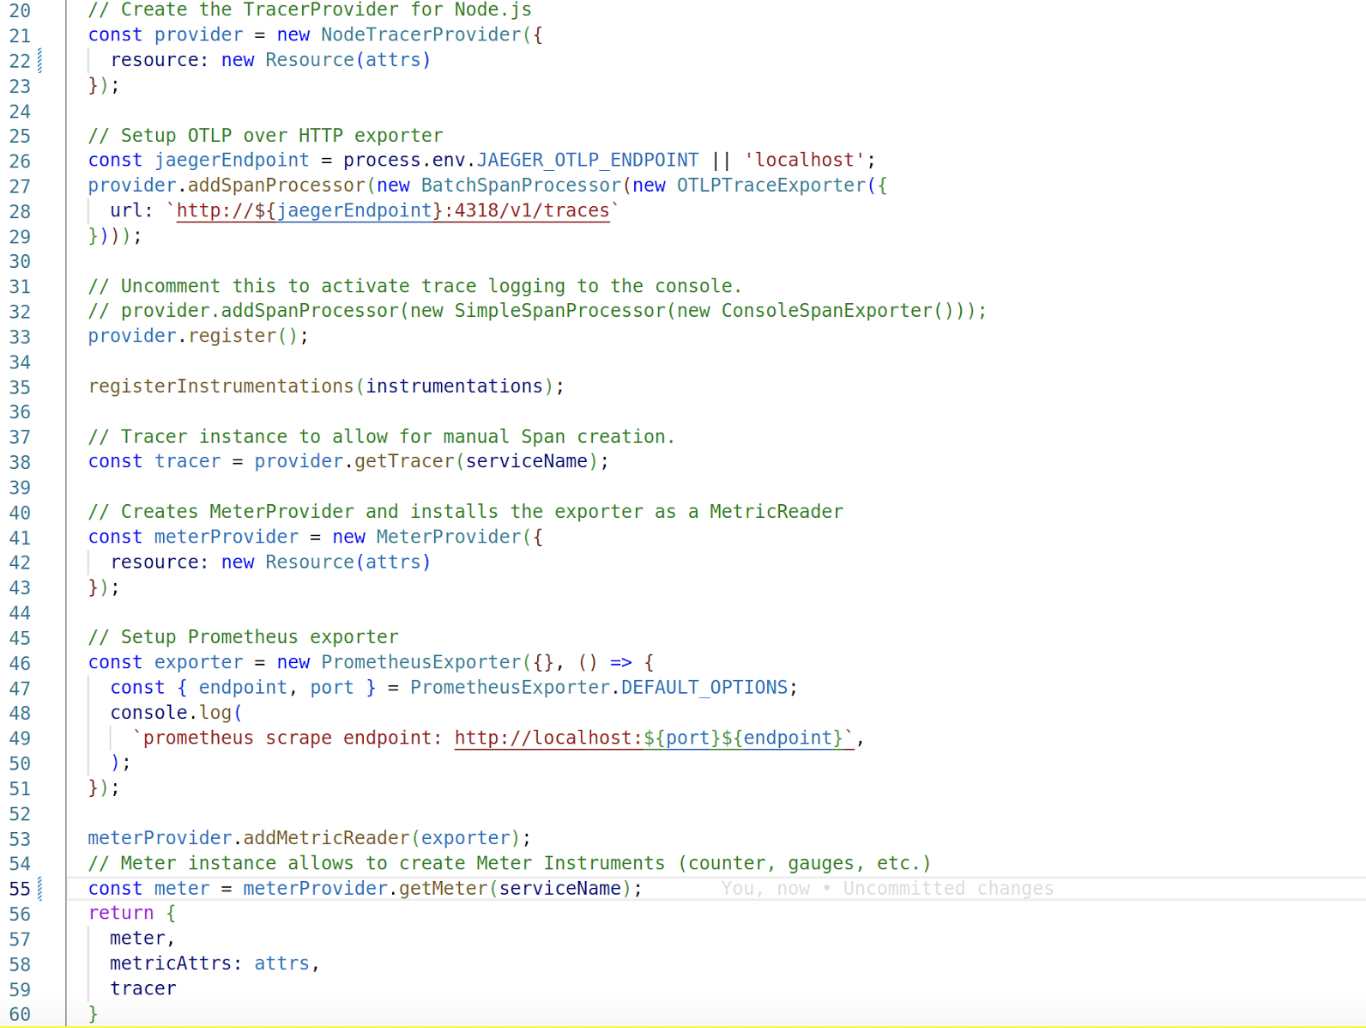
We also register instrumentations of specific modules (either core modules or popular userspace modules), which provide automatic Span creation of those modules.
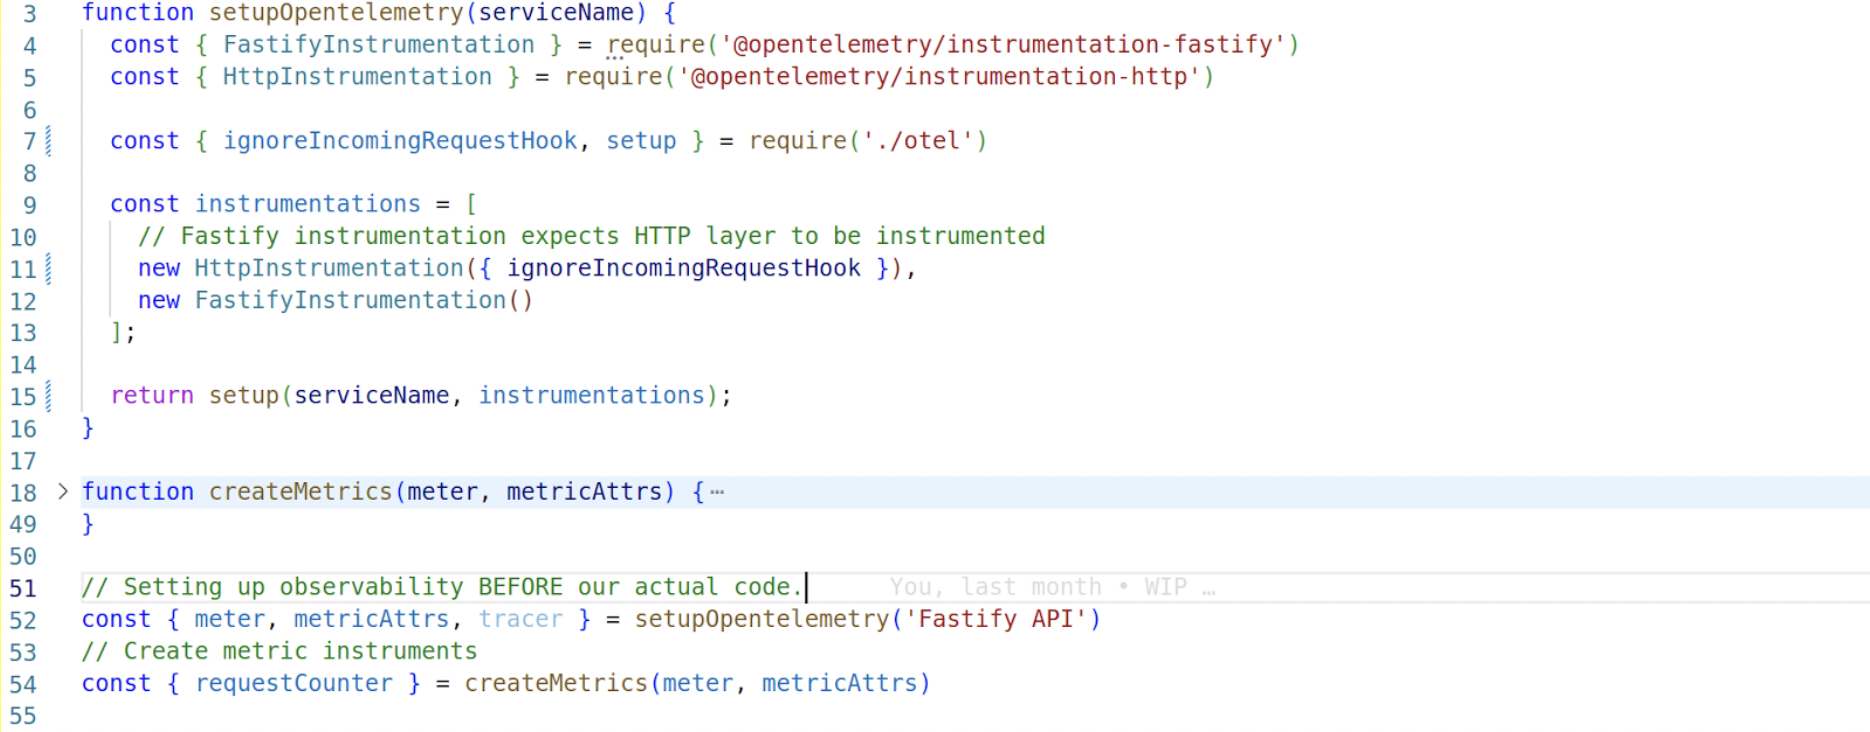
Finally, the only important thing to remember is that we need to initialize OpenTelemetry before our actual code; the reason is these instrumentation modules (in our case for http and fastify) monkeypatch the module they’re instrumenting.
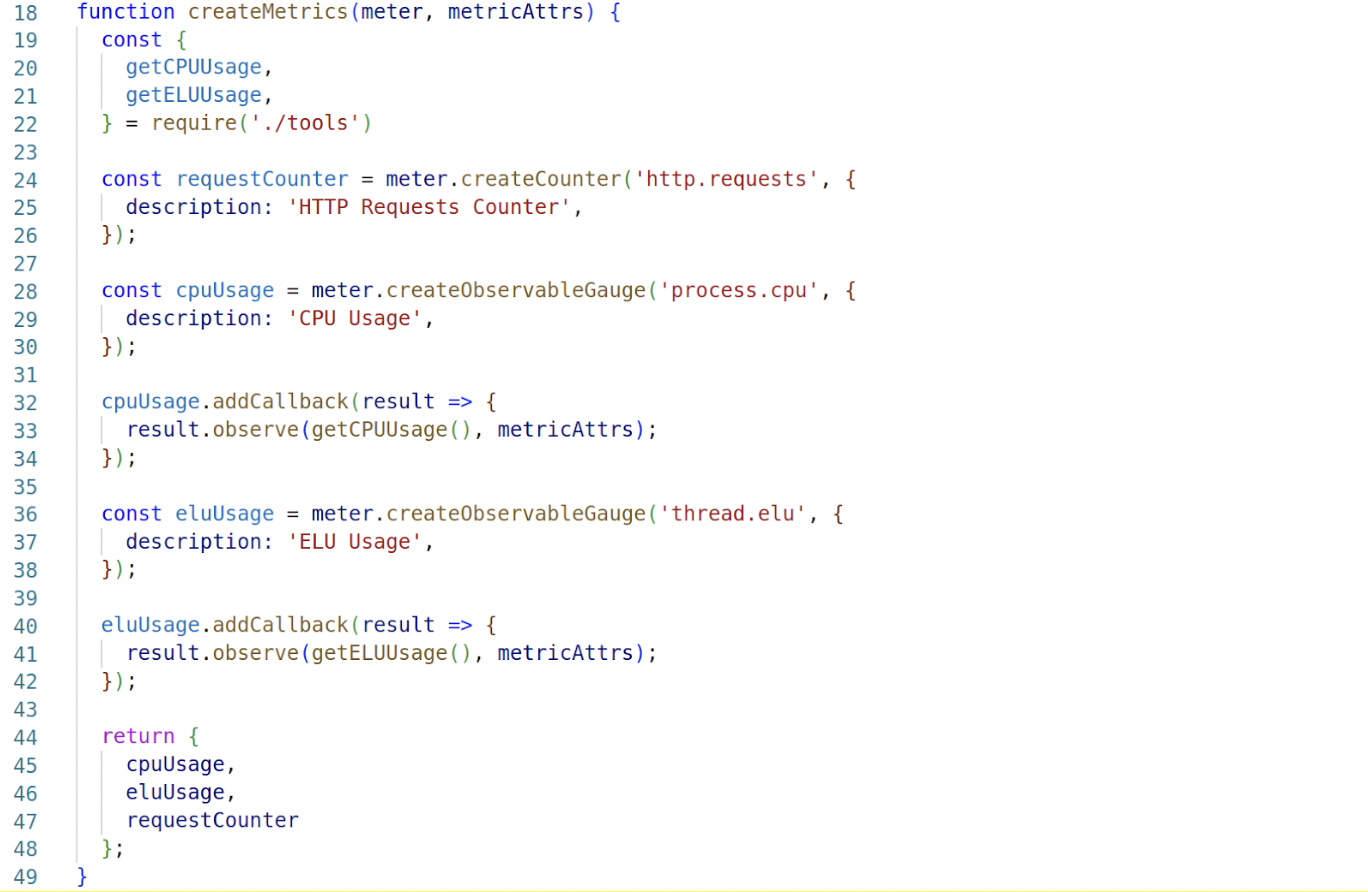
Also, we create the meter instruments because we will use them on every service: an HTTP request counter and a couple of observable gauges for CPU usage and ELU usage.
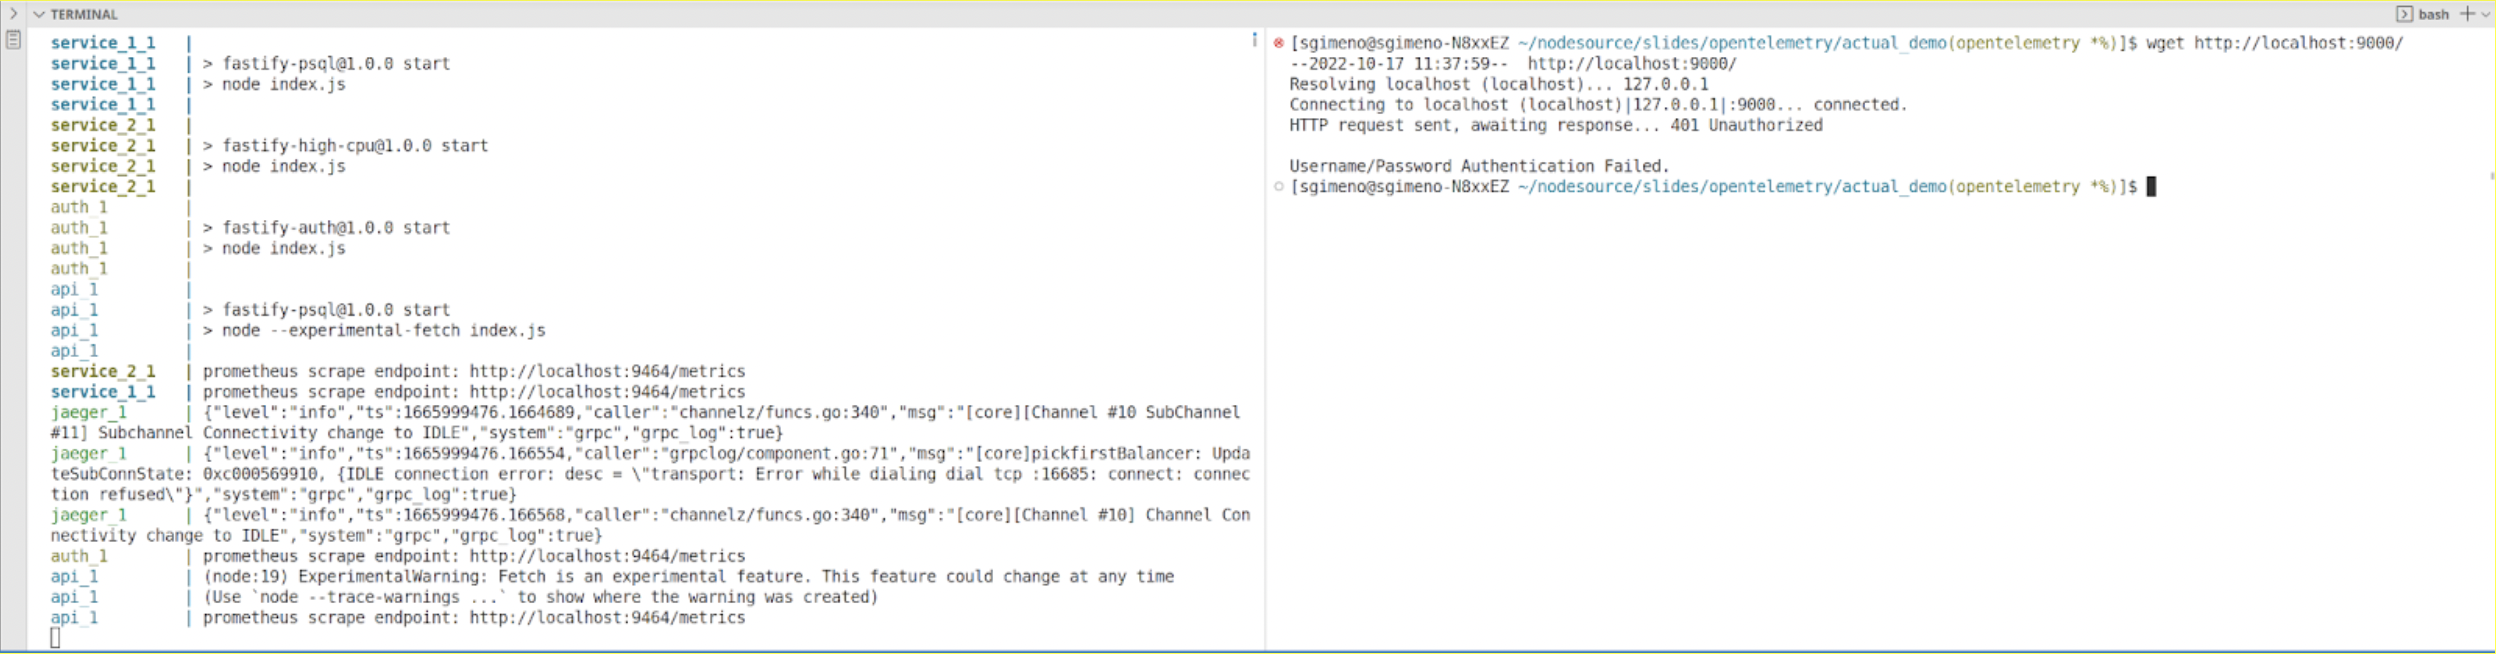
So let’s spin the application now and send a request to the API. It returns a 401 Not Authorized. Before trying to figure out what’s going on, let’s see if Prometheus and jaeger are actually receiving data.
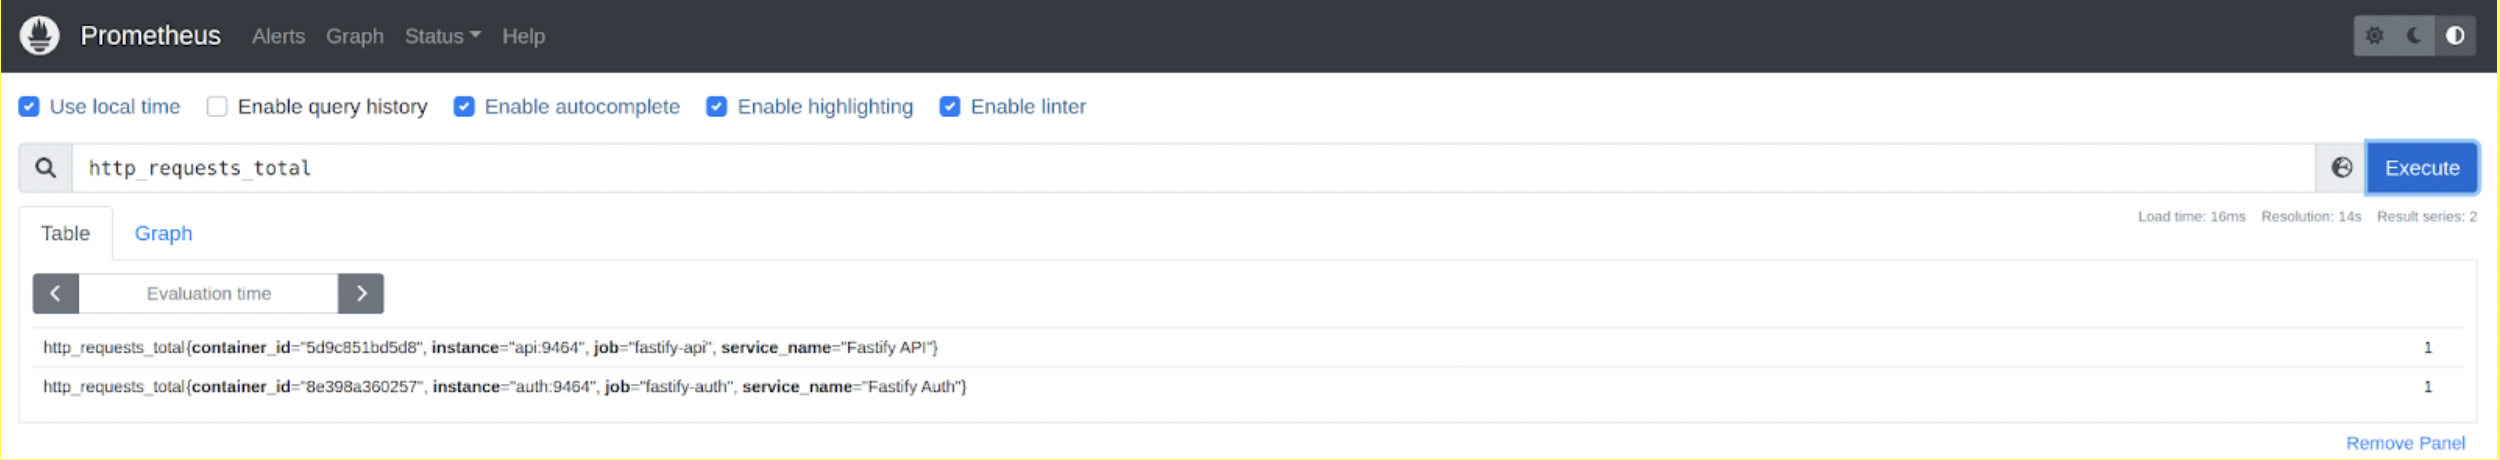
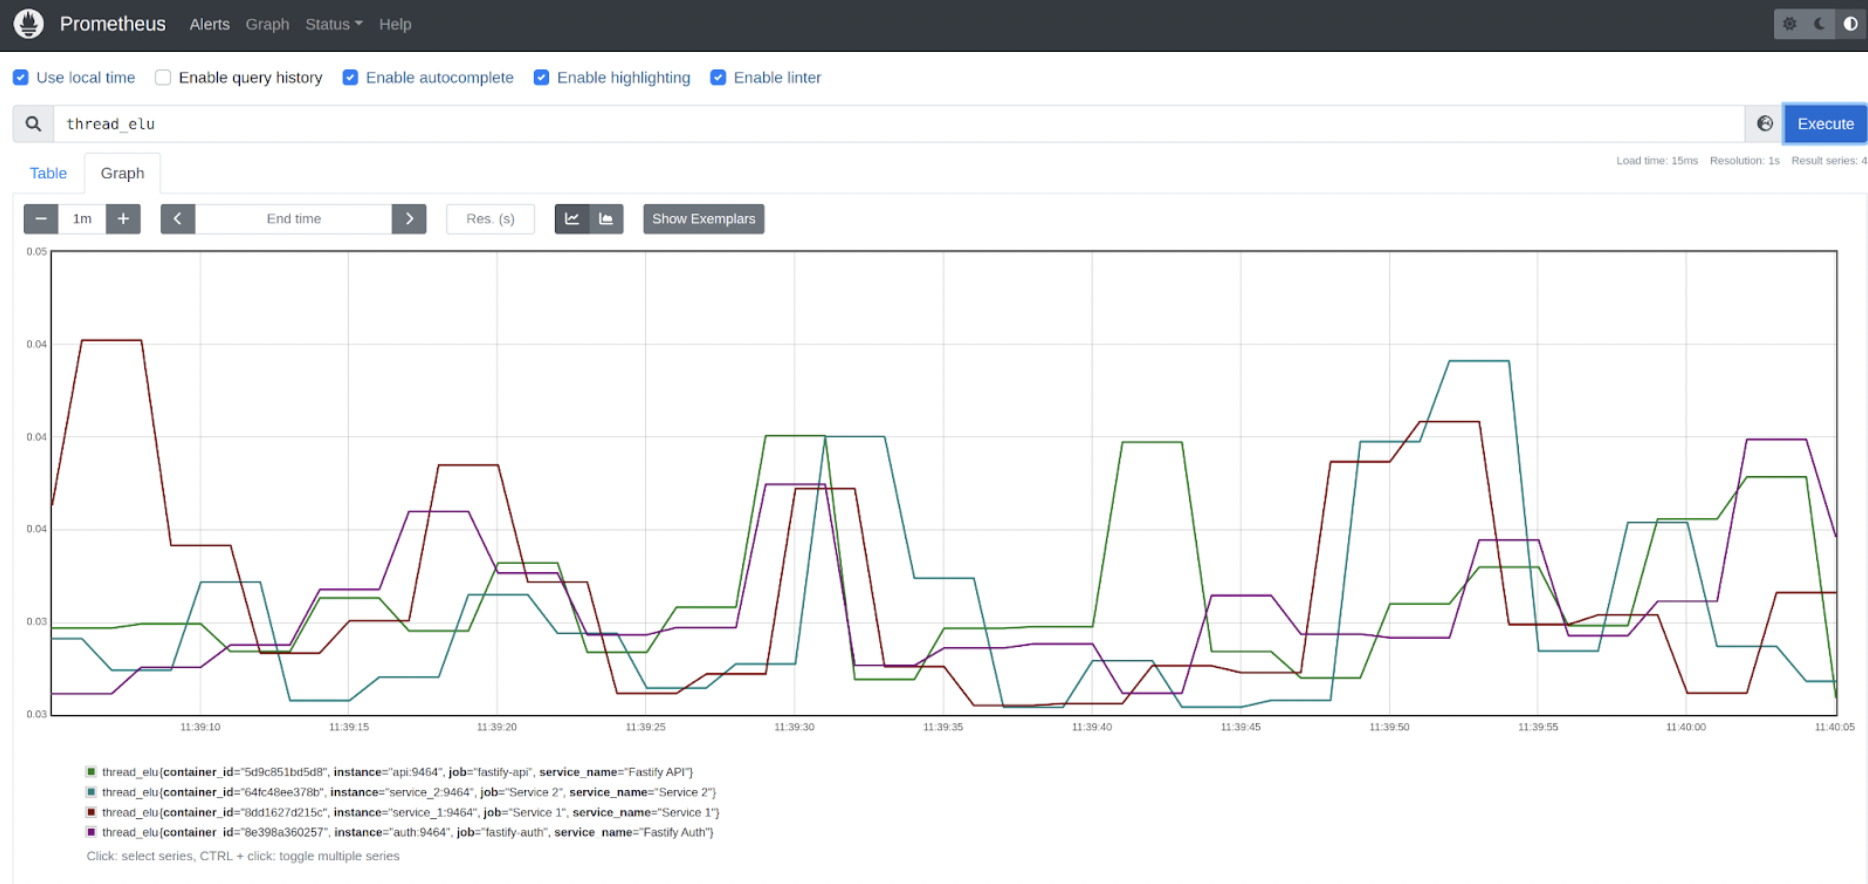
Step 3: Inspect Prometheus to review we’re receiving data
Let’s look at Prometheus first:
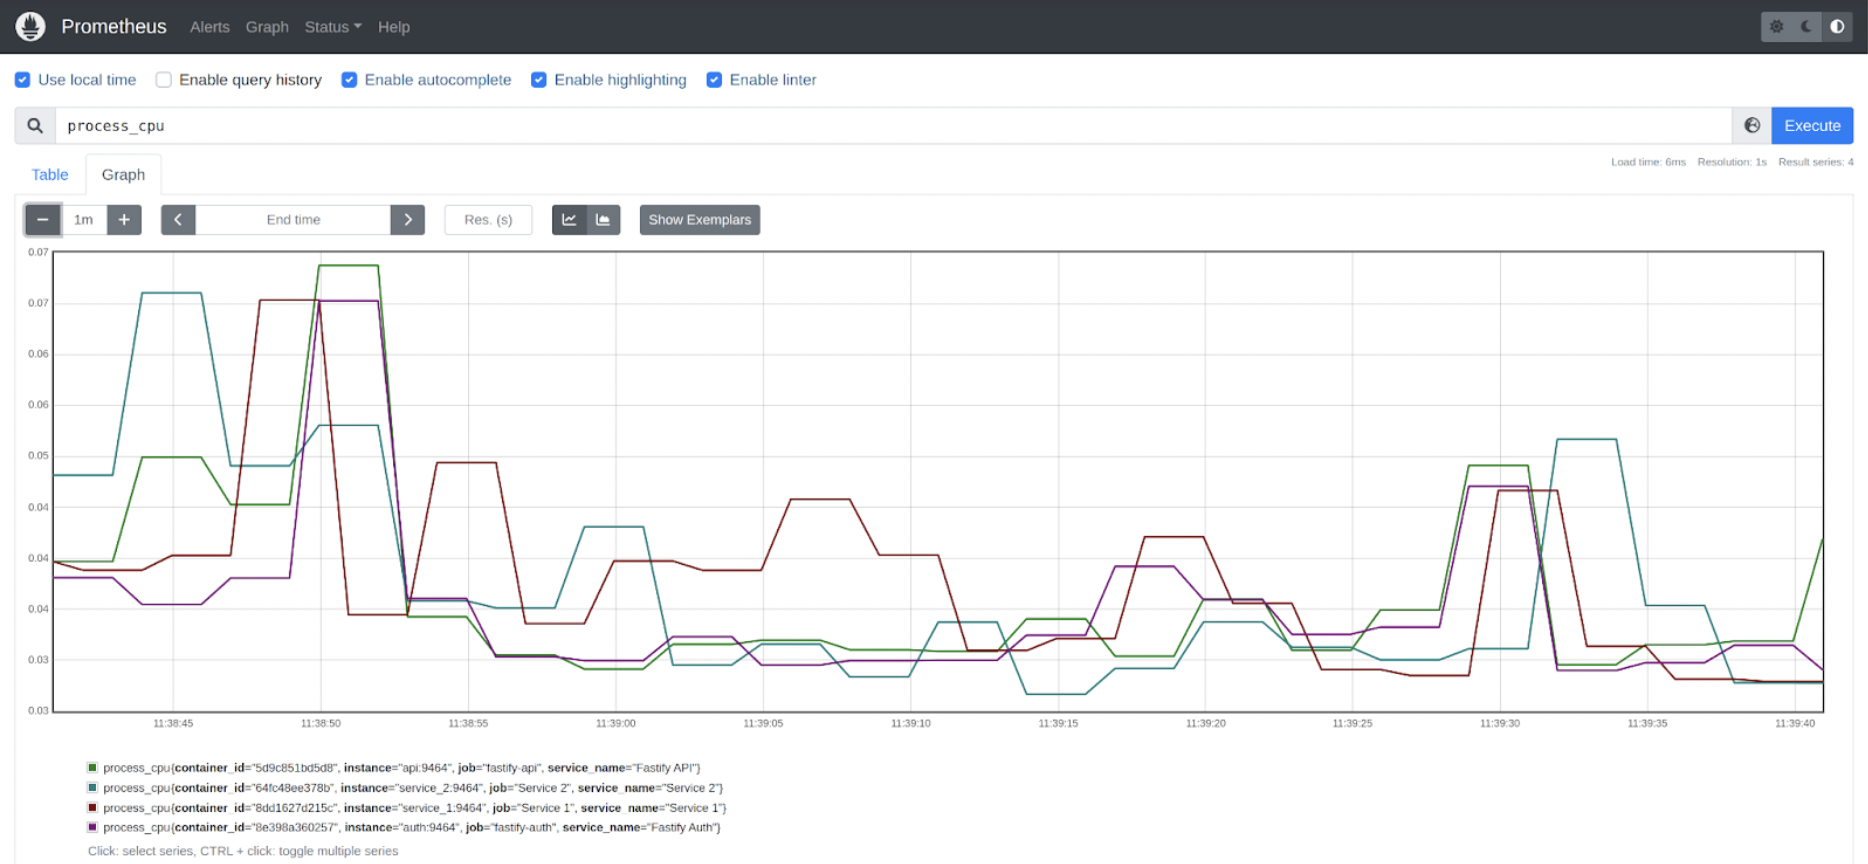
Looking at the HTTP requests counter, we can see there are 2 data points: one for the API service and another one for the AUTH service. Notice that the data we had in the Resource is service_name and container_id. We also can see the process_cpu is collecting data for the 4 services. The same is true for thread_elu.
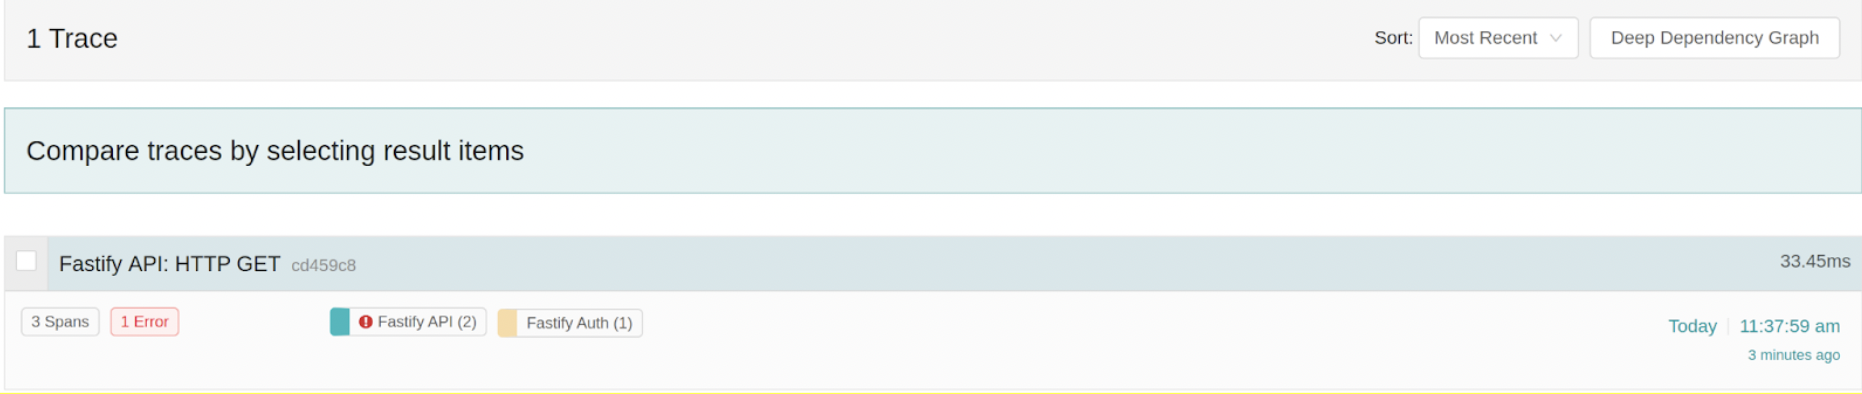
Step 4: Inspect Jaeger to review we’re receiving data
Let’s look at Jaeger now:
We can see that one trace corresponding to the HTTP request has been generated.
Also, look at this chart where the points represent traces, the X-axis is the timestamp, and the Y-axis is the duration. If we inspect the trace, we can see it consists of 3 spans, where every span represents an HTTP transaction, and it has been automatically generated by the instrumentation-HTTP modules:
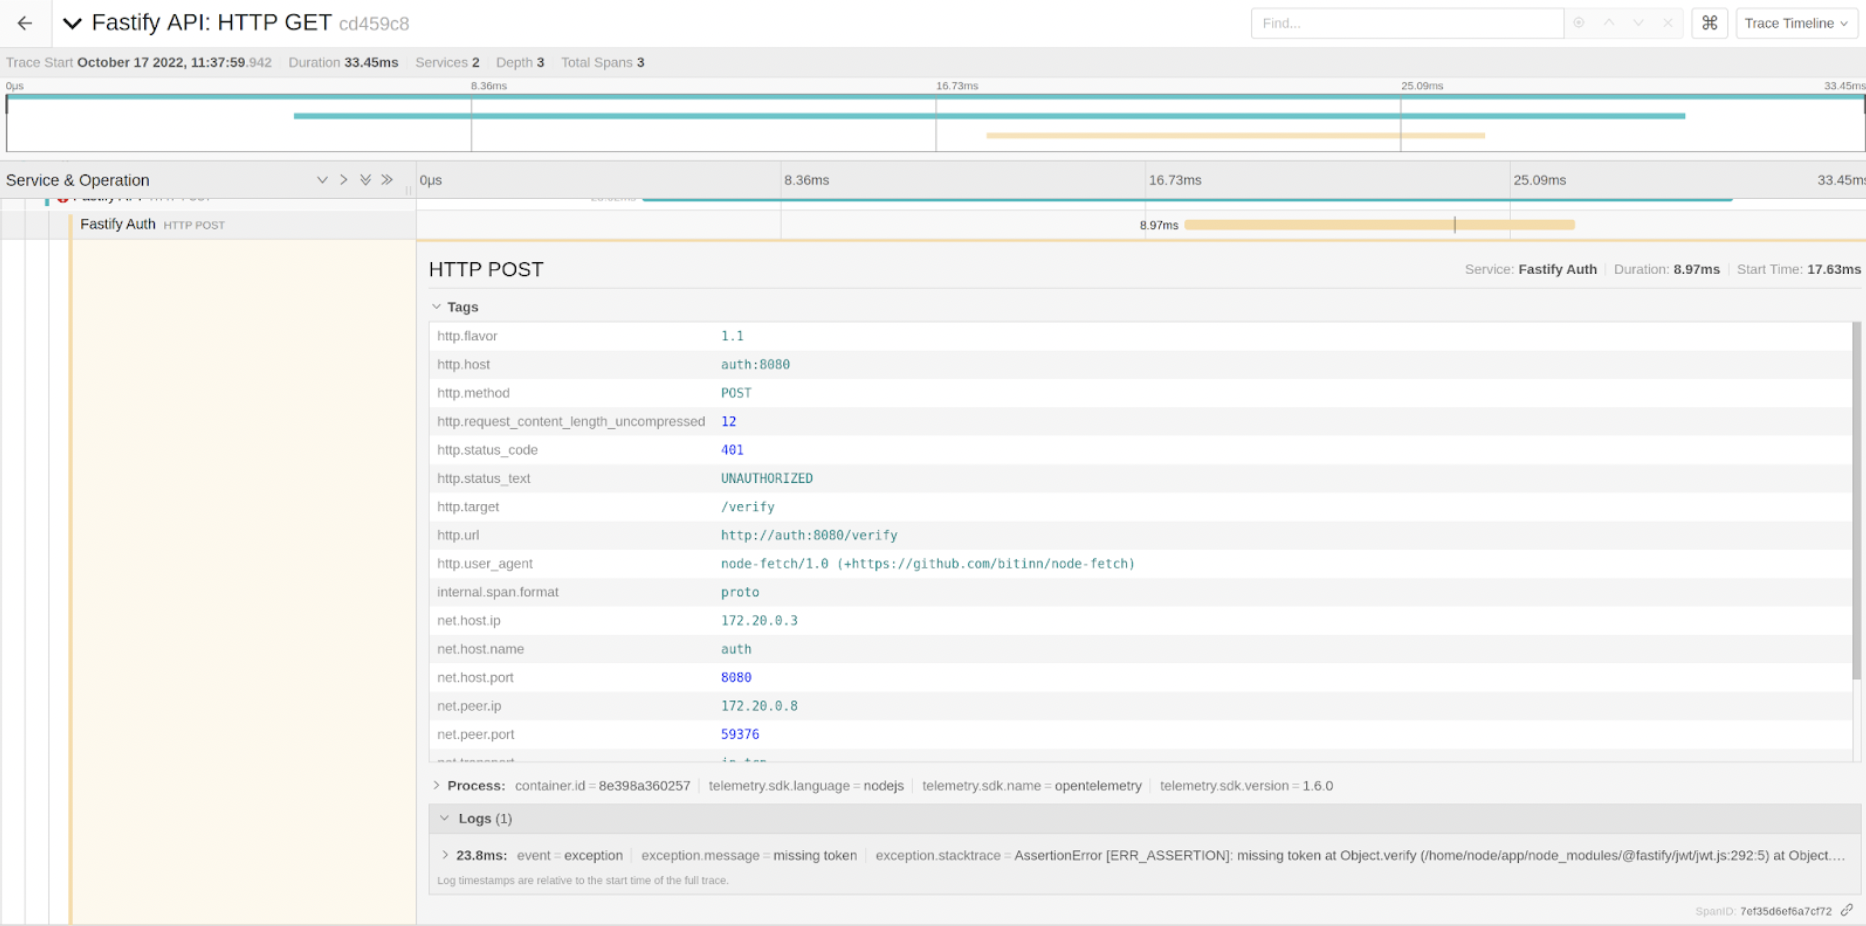
- The 1st span is an HTTP server transaction in the API service (the incoming HTTP request).
- The 2nd span represents a POST request to AUTH from API.
- The 3rd one represents the incoming HTTP POST in AUTH. If we inspect a bit this last span, apart from the typical attributes associated with the request (HTTP method, request_url, status_code…).
We can see there’s a Log associated with the Span this makes it very useful as we can know exactly which request caused the error. By inspecting it, we found out that the reason for the failure was missing the auth token.
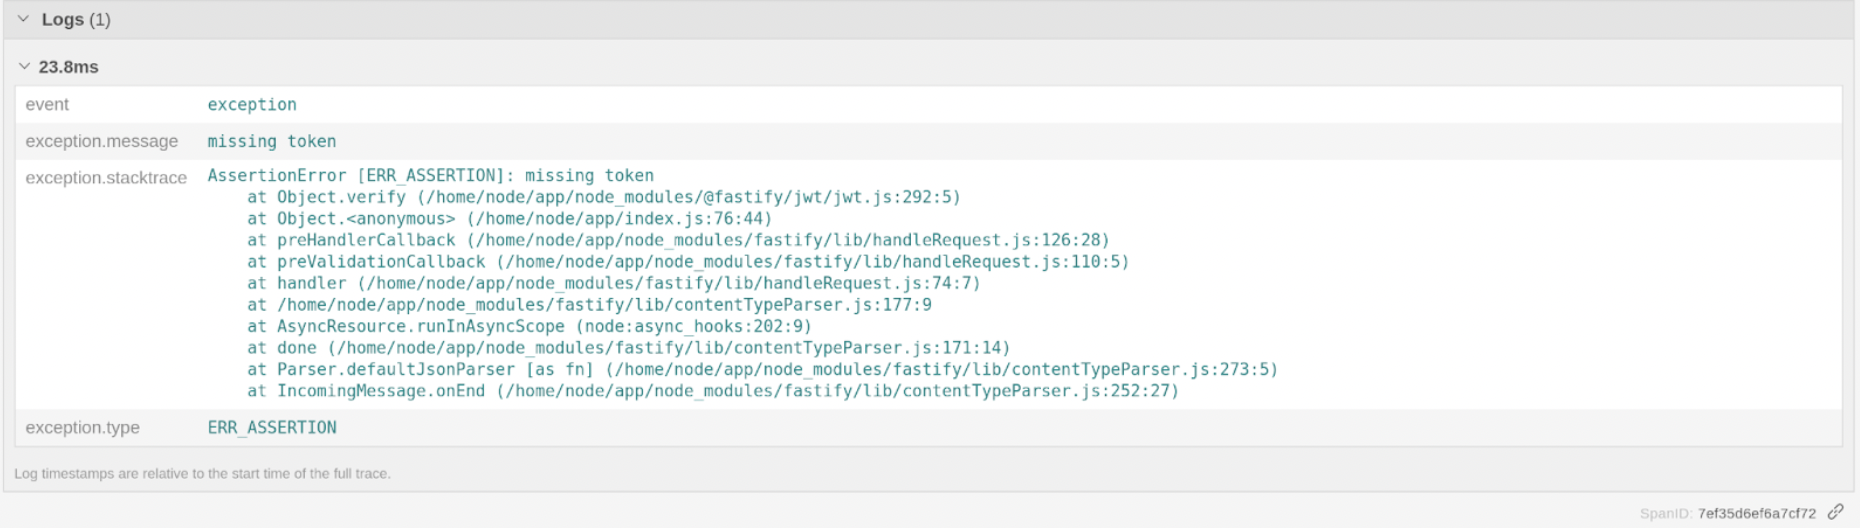
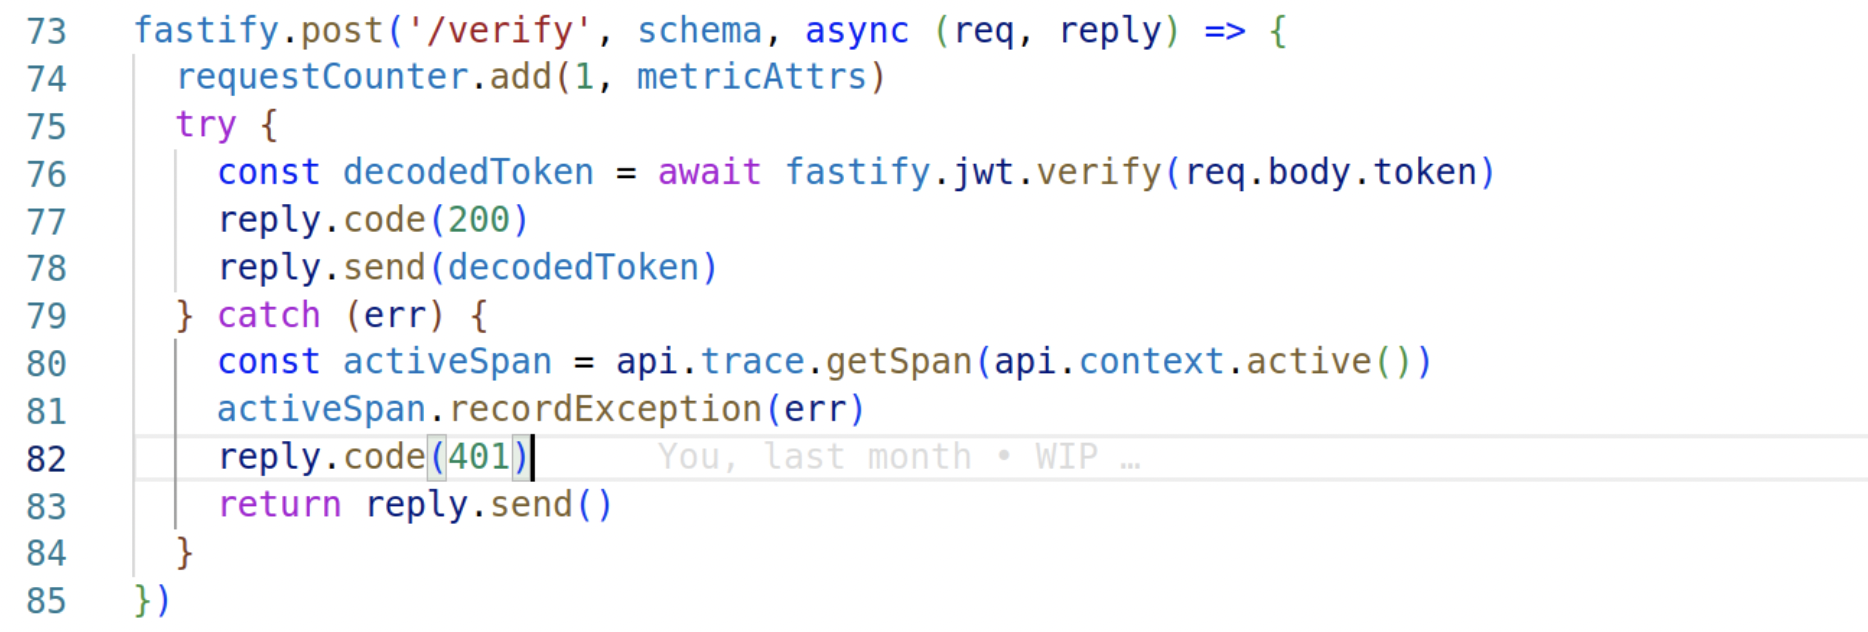
This piece of information wasn’t generated automatically, though, but it’s very easy to do. So in the verify route from the service, in case there’s an error verifying the token, we retrieve the active span from the current context and just call recordException() with the error. As simple as that.
Well, so far, so good. Knowing what the problem is, let’s add the auth token and check if everything works:
curl http://localhost:9000/ -H "Authorization: Bearer eyJ0eXAiOiJKV1QiLCJhbGciOiJIUzI1NiJ9.eyJpc3MiOiIiLCJpYXQiOjE2NjIxMTQyMjAsImV4cCI6MTY5MzY1MDIyMCwiYXVkIjoid3d3LmV4YW1wbGUuY29tIiwic3ViIjoiIiwibGljZW5zZUtleSI6ImZmZmZmLWZmZmZmLWZmZmZmLWZmZmZmLWZmZmZmIiwiZW1haWwiOiJqcm9ja2V0QGV4YW1wbGUuY29tIn0.PYQoR-62ba9R6HCxxumajVWZYyvUWNnFSUEoJBj5t9I"
Ok, now it succeeded. Let’s look at Jaeger now. We can see the new trace here, and we can see that it contains 7 spans, and no error was generated.
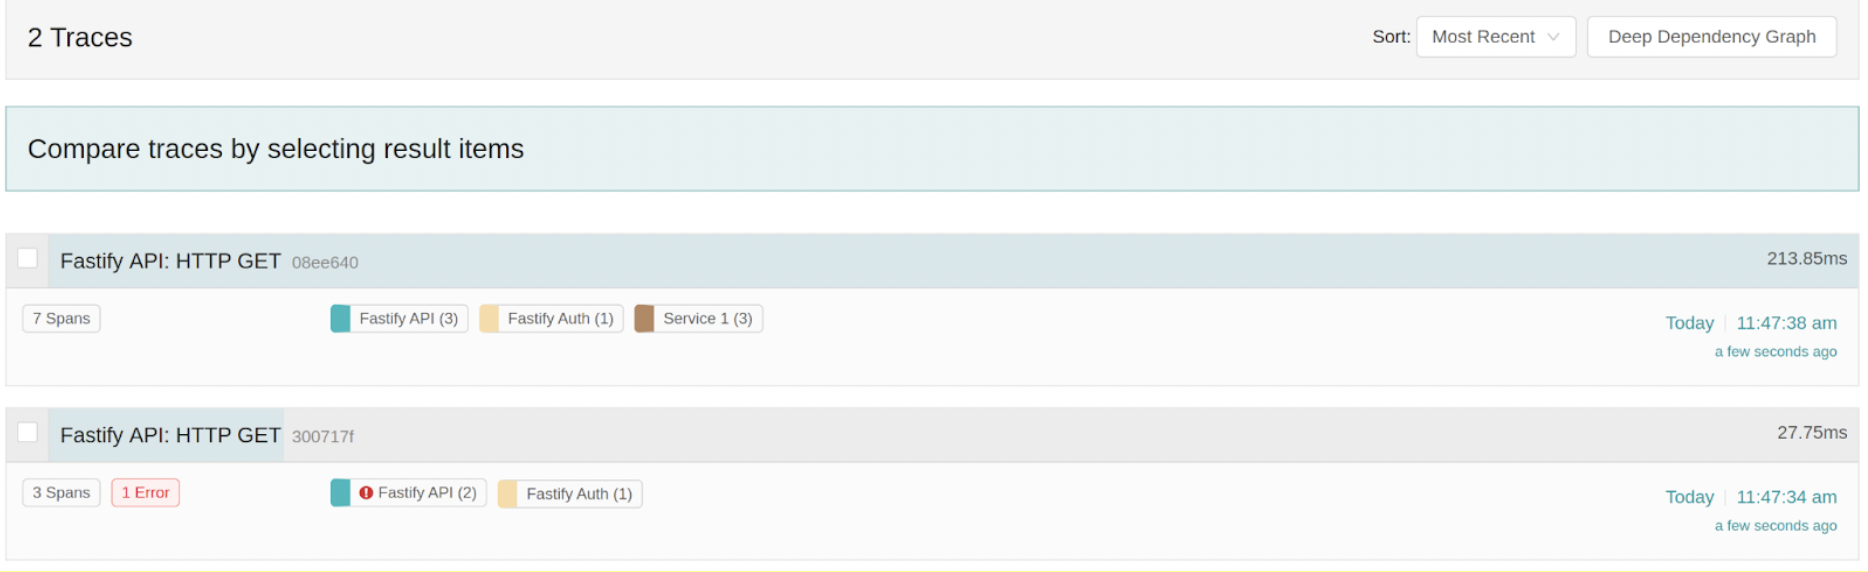
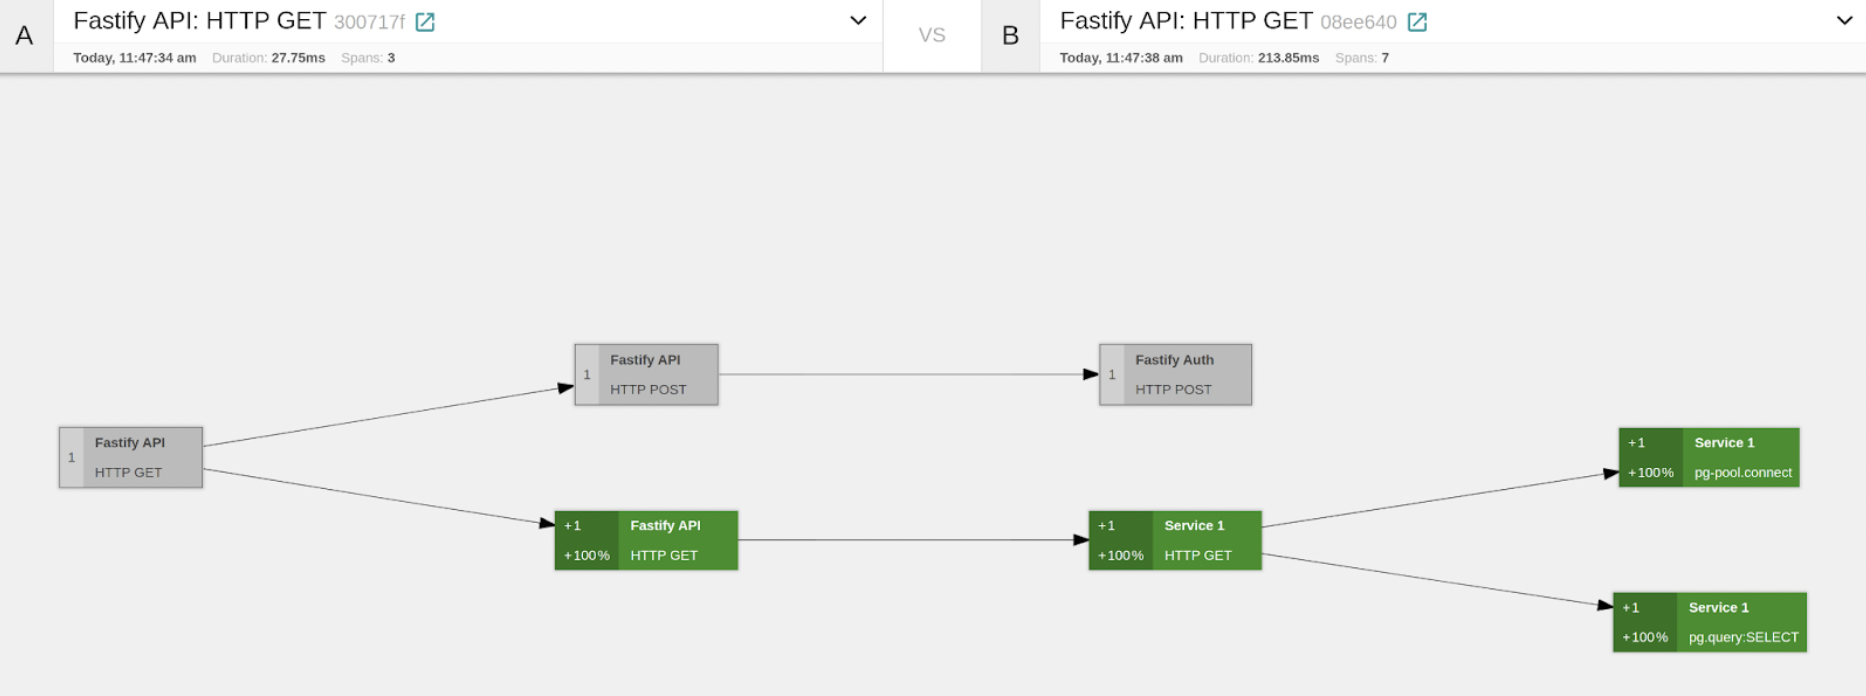
Now, it’s time to show one very nice feature of Jaeger. We can compare both traces, and we can see in grey the Spans that are equal, whereas we can see in Green the Spans that are new. So just by looking at this overview, we can see that if we’re correctly Authorized, the API sends a GET request to SERVICE1, which then performs a couple of operations against POSTGRES. If we inspect one of the POSTGRES spans (the query), we can see useful information there, such as the actual QUERY. This is possible because we have registered the instrumentation-pg module in SERVICE1.
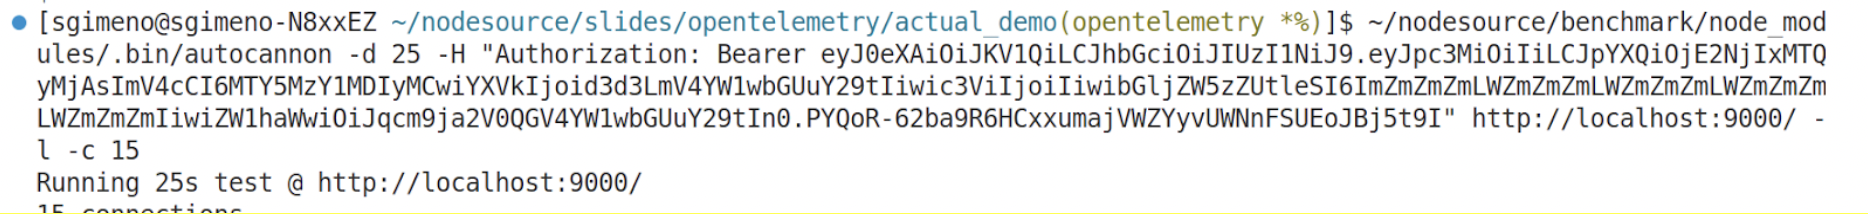
And finally, let’s do a more interesting experiment. We will inject load to the application for 20 seconds with autocannon…
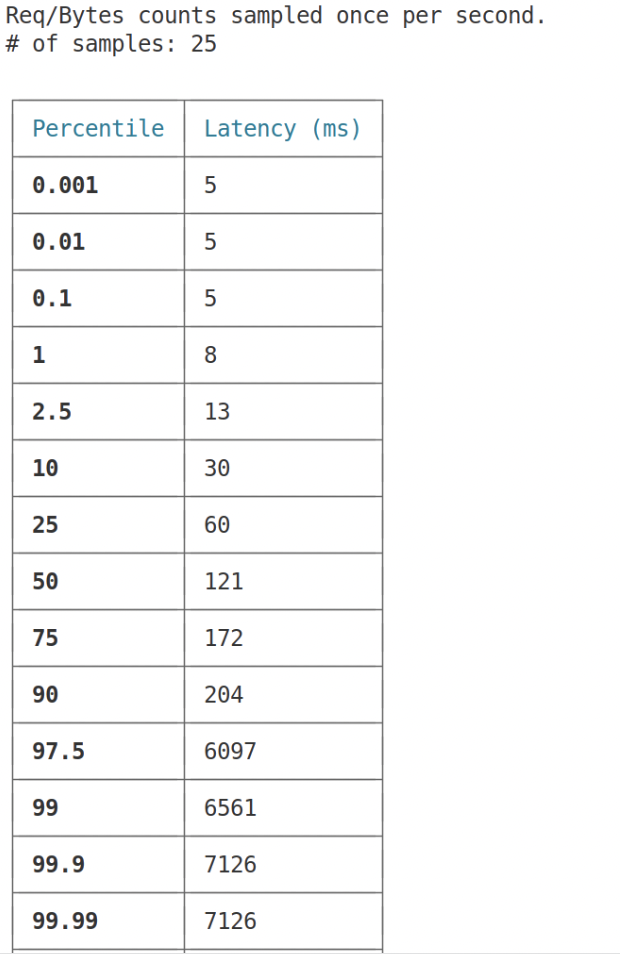
If we look at the latency chart, we see some interesting data: up until at least the 90th percentile, the latency is basically below 300ms, whereas starting at least from 97.5%, the latency goes up a lot. More than 3secs. This is Unacceptable 🧐. Let’s see if we can figure out what’s going on 💪.
Step 5: Getting deeper at Jaeger 👀
Looking at Jaeger and limiting this to like 500 spans, we can see that the graph here depicts what the latency char showed. Most of the requests are fast, whereas there are some significant outliers.
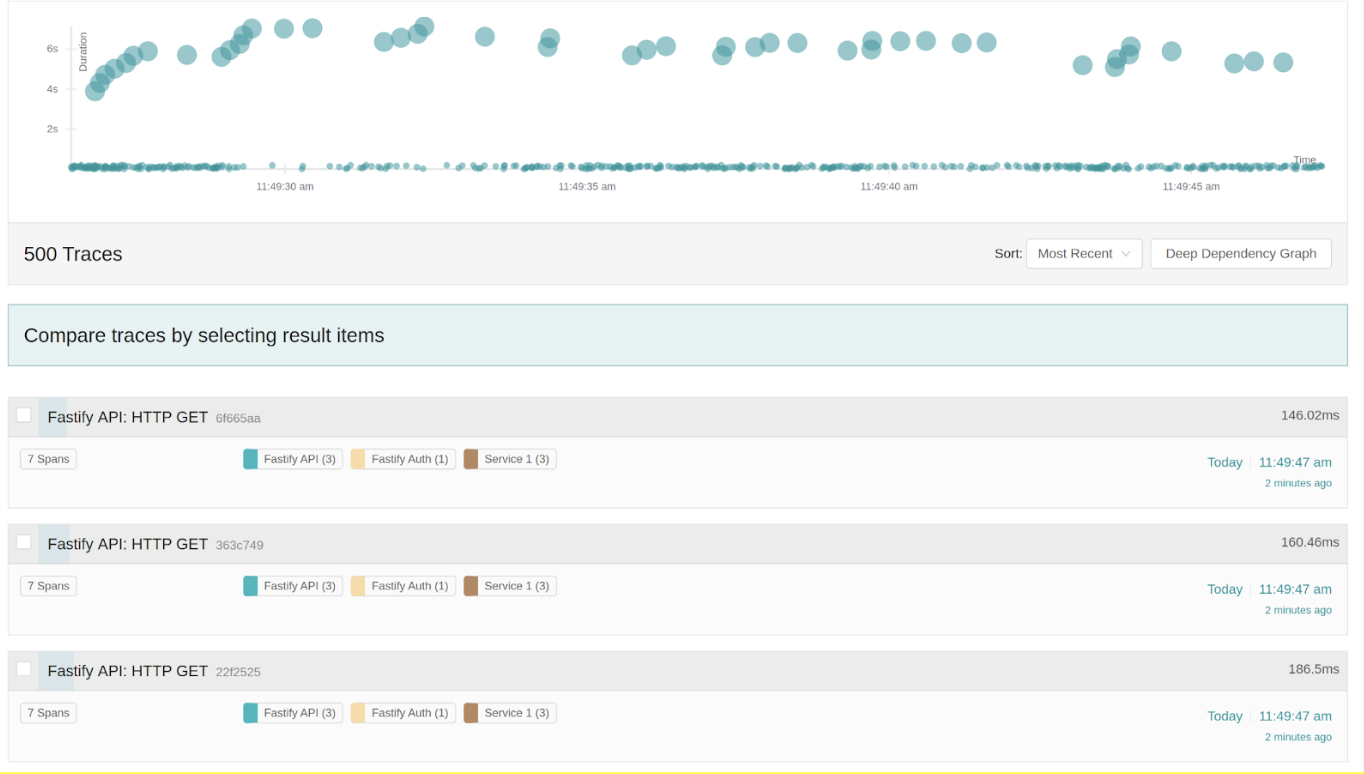
Let’s compare one of the fast vs. slow traces. In addition to querying the database, we can see the slow trace in that SERVICE1 sends a request to SERVICE2. That’s useful info for sure. Let’s take a look more closely at the slow trace.
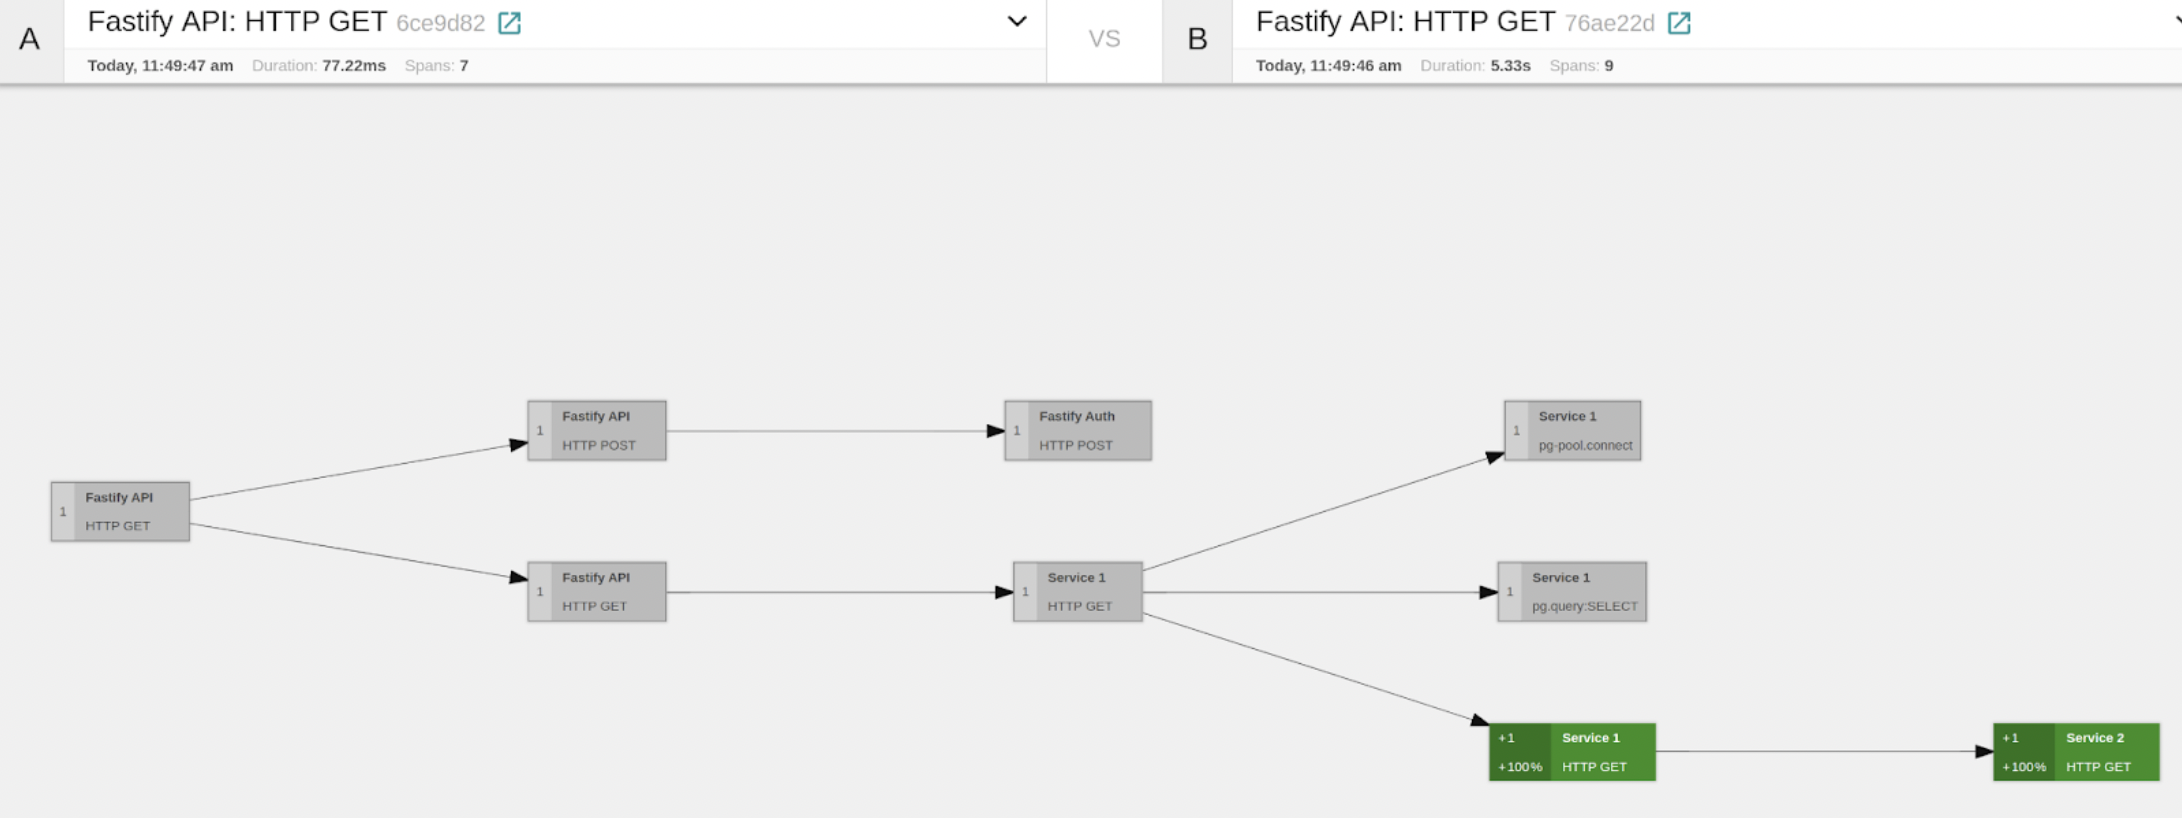
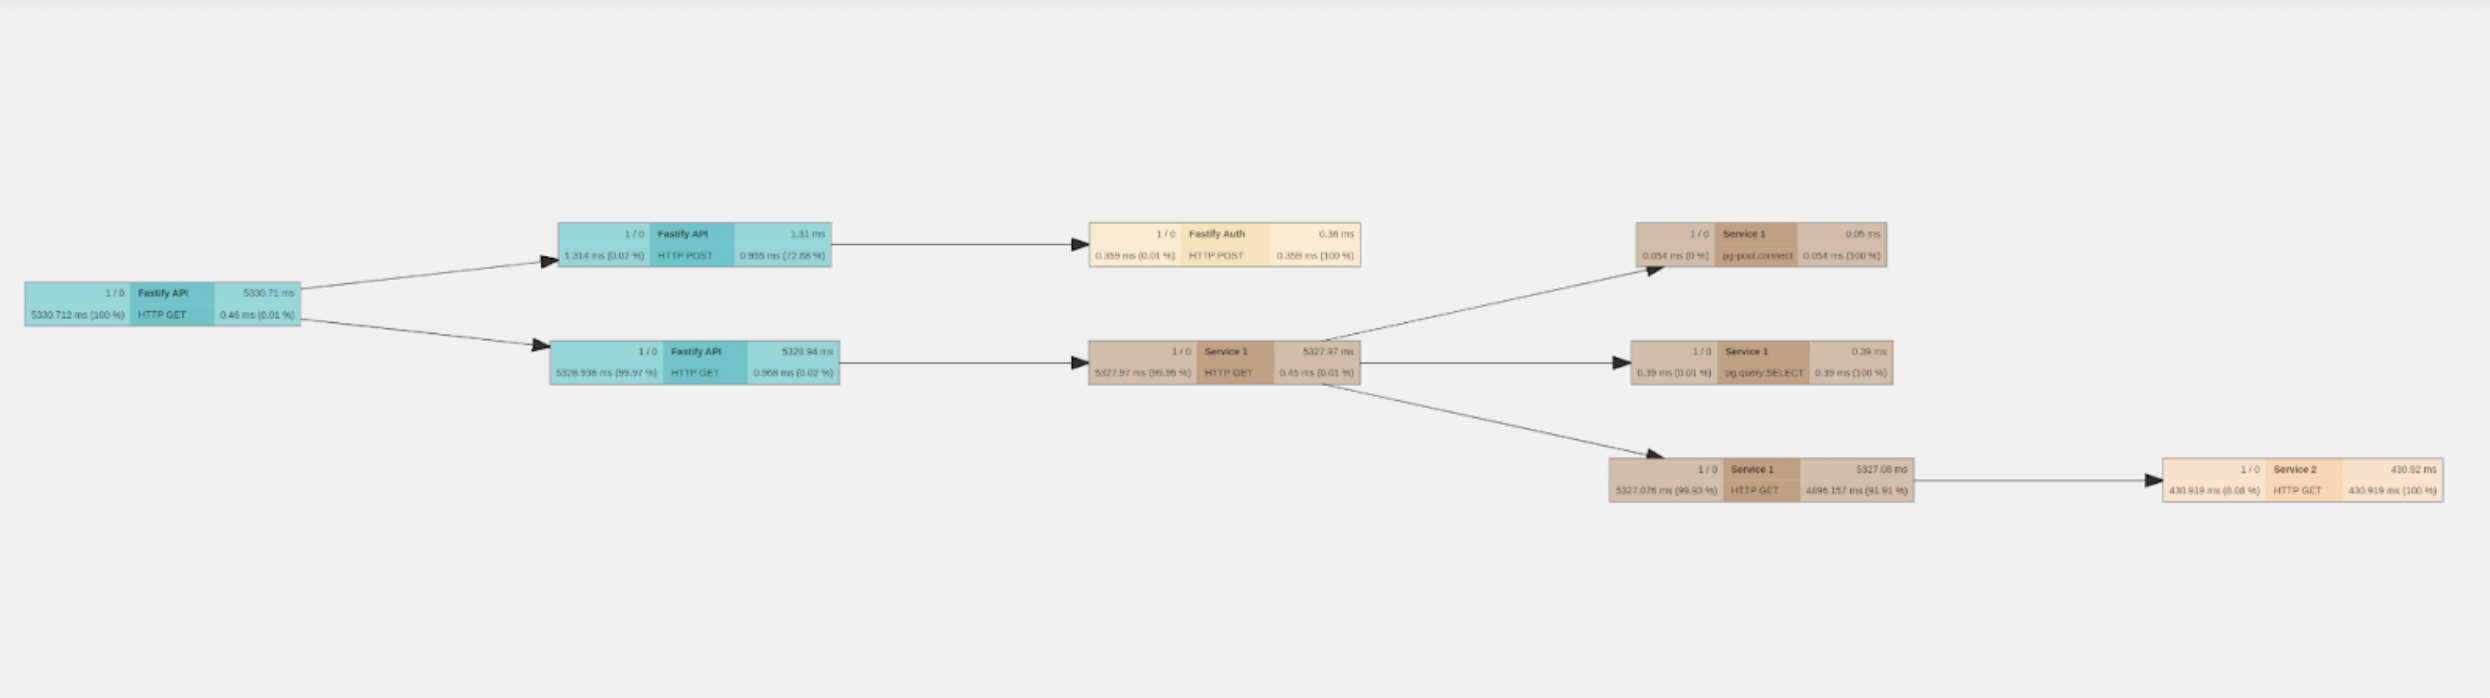
In the Trace Graph view, every node represents a Span, and on the left-hand side, we can see the percentage of time with respect to the total trace duration that the subgraph that has this node as root takes. So by inspecting this, we can see that the branch representing the HTTP GET from SERVICE1 to SERVICE2 takes most of the time of the span. So it seems the main suspect is SERVICE2. Let’s take a look at the Metrics now. They might give us more information. If we look at the thread.elu, we can see that for SERVICE2, it went 100% for some seconds. This would explain the observed behavior.
So now, going to the SERVICE2 code route, we can easily spot the issue. We were performing a Fibonacci operation. Of course, this was easy to spot as this is a demo, but in real scenarios, this would not be so simple, and we would need some other methods, such as CPU Profiling, but regardless, the info we collected would help us narrow down the issue quite significantly.
So, that’s it for the demo. We’ve created a repo where you can access the full code, so go play with it! 😎
Main Takeaways
Finally, we just want to share the main takeaways about implementing observability with Open Software Tools:
- Setting up observability in our Node.js apps is actually not that hard.
- It allows us to observe requests as they propagate through a distributed system, giving us a clear picture of what might be happening.
- It helps identify points of failure and causes of poor performance. (for some cases, some other tools might also be needed: CPU profiling, heap snapshots).
- Adding observability to our code, especially tracing, comes with a cost. So Be cautious! ☠️But we are not going to go deeper into this, as it could be a topic for another article.
Before you go
If you're looking to implement observability in your project professionally, you might want to check out N|Solid, and our '10 key functionalities'. We invited you to follow us on Twitter and keep the conversation!